1856 United States presidential election in Pennsylvania
| |||||||||||||||||||||||||||||||||
| |||||||||||||||||||||||||||||||||
 County Results
| |||||||||||||||||||||||||||||||||
| |||||||||||||||||||||||||||||||||
| Elections in Pennsylvania |
|---|
 |
|
|
The 1856 United States presidential election in Pennsylvania took place on November 4, 1856, as part of the 1856 United States presidential election. Voters chose 27 representatives, or electors to the Electoral College, who voted for president and vice president.
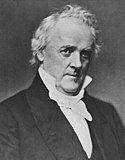
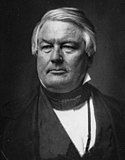
Pennsylvania voted for the Democratic candidate, James Buchanan, over the Republican candidate, John C. Frémont, and the Know Nothing candidate, Millard Fillmore. Buchanan, a lifelong Pennsylvanian, won his home state by a margin of 18.12%.
Results
[edit]| 1856 United States presidential election in Pennsylvania[1] | |||||
|---|---|---|---|---|---|
| Party | Candidate | Votes | Percentage | Electoral votes | |
| Democratic | James Buchanan | 230,686 | 50.13% | 27 | |
| Republican | John C. Frémont | 147,286 | 32.01% | 0 | |
| Know Nothing | Millard Fillmore | 82,189 | 17.86% | 0 | |
| Totals | 460,161 | 100.0% | 27 | ||
Results by County
[edit]| County | James Buchanan
Democratic |
John C. Frémont
Republican |
Millard Fillmore
Know Nothing |
Total votes cast | |||
|---|---|---|---|---|---|---|---|
| # | % | # | % | # | % | ||
| Adams | 2,637 | 52.68% | 1,120 | 22.37% | 1,249 | 24.95% | 5,006 |
| Allegheny | 9,062 | 37.41% | 13,671 | 56.44% | 1,488 | 6.14% | 24,221 |
| Armstrong | 2,680 | 45.96% | 2,963 | 50.81% | 188 | 3.22% | 5,831 |
| Beaver | 1,905 | 39.70% | 2,658 | 55.39% | 236 | 4.92% | 4,799 |
| Bedford | 2,458 | 52.30% | 306 | 6.51% | 1,936 | 41.19% | 4,700 |
| Berks | 11,272 | 70.92% | 1,037 | 6.52% | 3,586 | 22.56% | 15,895 |
| Blair | 2,069 | 41.68% | 445 | 8.96% | 2,450 | 49.36% | 4,964 |
| Bradford | 2,314 | 24.74% | 6,938 | 74.18% | 101 | 1.08% | 9,353 |
| Bucks | 6,517 | 54.61% | 4,682 | 39.23% | 735 | 6.16% | 11,934 |
| Butler | 2,648 | 43.30% | 3,401 | 55.61% | 67 | 1.10% | 6,116 |
| Cambria | 2,987 | 62.77% | 804 | 16.89% | 968 | 20.34% | 4,759 |
| Carbon | 1,866 | 61.73% | 692 | 22.89% | 465 | 15.38% | 3,023 |
| Centre | 2,895 | 55.28% | 390 | 7.45% | 1,952 | 37.27% | 5,237 |
| Chester | 6,333 | 48.38% | 5,308 | 40.55% | 1,448 | 11.06% | 13,089 |
| Clarion | 2,760 | 61.36% | 788 | 17.52% | 950 | 21.12% | 4,498 |
| Clearfield | 1,978 | 59.94% | 718 | 21.76% | 604 | 18.30% | 3,300 |
| Clinton | 1,485 | 53.32% | 618 | 22.19% | 682 | 24.49% | 2,785 |
| Columbia | 2,889 | 66.46% | 1,239 | 28.50% | 219 | 5.04% | 4,347 |
| Crawford | 3,391 | 38.55% | 5,360 | 60.94% | 45 | 0.51% | 8,796 |
| Cumberland | 3,427 | 52.90% | 1,472 | 22.72% | 1,579 | 24.37% | 6,478 |
| Dauphin | 3,094 | 43.28% | 1,615 | 22.59% | 2,439 | 34.12% | 7,148 |
| Delaware | 2,005 | 43.54% | 1,590 | 34.53% | 1,010 | 21.93% | 4,605 |
| Elk | 575 | 63.75% | 275 | 30.49% | 52 | 5.76% | 902 |
| Erie | 2,584 | 32.18% | 5,156 | 64.22% | 289 | 3.60% | 8,029 |
| Fayette | 3,554 | 52.13% | 2,089 | 30.64% | 1,174 | 17.22% | 6,817 |
| Franklin | 3,469 | 48.53% | 2,446 | 34.22% | 1,233 | 17.25% | 7,148 |
| Fulton | 970 | 57.81% | 142 | 8.46% | 566 | 33.73% | 1,678 |
| Greene | 2,747 | 63.09% | 1,321 | 30.34% | 286 | 6.57% | 4,354 |
| Huntingdon | 2,164 | 45.70% | 926 | 19.56% | 1,645 | 34.74% | 4,735 |
| Indiana | 1,762 | 31.26% | 3,612 | 64.08% | 263 | 4.67% | 5,637 |
| Jefferson | 1,463 | 46.58% | 1,063 | 33.84% | 615 | 19.58% | 3,141 |
| Juniata | 1,365 | 52.66% | 480 | 18.52% | 747 | 28.82% | 2,592 |
| Lancaster | 8,731 | 43.81% | 6,608 | 33.15% | 4,592 | 23.04% | 19,931 |
| Lawrence | 1,220 | 27.85% | 3,065 | 69.96% | 96 | 2.19% | 4,381 |
| Lebanon | 2,511 | 46.83% | 2,414 | 45.02% | 437 | 8.15% | 5,362 |
| Lehigh | 4,426 | 56.85% | 3,237 | 41.58% | 122 | 1.57% | 7,785 |
| Luzerne | 6,791 | 54.29% | 4,850 | 38.77% | 868 | 6.94% | 12,509 |
| Lycoming | 3,324 | 55.14% | 934 | 29.36% | 1,770 | 15.49% | 6,028 |
| McKean | 526 | 37.98% | 812 | 58.63% | 47 | 3.39% | 1,385 |
| Mercer | 2,699 | 41.50% | 3,686 | 56.68% | 118 | 1.81% | 6,503 |
| Mifflin | 1,491 | 54.08% | 216 | 7.83% | 1,050 | 38.08% | 2,757 |
| Monroe | 2,275 | 78.34% | 560 | 19.28% | 69 | 2.38% | 2,904 |
| Montgomery | 7,134 | 58.27% | 2,845 | 23.24% | 2,265 | 18.50% | 12,244 |
| Montour | 1,271 | 60.93% | 666 | 31.93% | 149 | 7.14% | 2,086 |
| Northampton | 5,260 | 63.63% | 1,168 | 14.13% | 1,838 | 22.24% | 8,266 |
| Northumberland | 3,059 | 61.61% | 566 | 11.40% | 1,340 | 26.99% | 4,965 |
| Perry | 2,135 | 52.55% | 521 | 12.82% | 1,407 | 34.63% | 4,063 |
| Philadelphia | 38,222 | 54.37% | 7,993 | 11.37% | 24,084 | 34.26% | 70,299 |
| Pike | 862 | 75.15% | 270 | 23.54% | 15 | 1.31% | 1,147 |
| Potter | 1,264 | 65.26% | 667 | 34.43% | 6 | 0.31% | 1,937 |
| Schuylkill | 7,035 | 59.09% | 2,188 | 18.38% | 2,682 | 22.53% | 11,905 |
| Snyder | 1,255 | 45.44% | 443 | 16.04% | 1,064 | 38.52% | 2,762 |
| Somerset | 1,763 | 38.11% | 1,458 | 31.52% | 1,405 | 30.37% | 4,626 |
| Sullivan | 538 | 60.11% | 309 | 34.53% | 48 | 5.36% | 895 |
| Susquehanna | 2,548 | 39.44% | 3,861 | 59.77% | 51 | 0.79% | 6,460 |
| Tioga | 1,386 | 23.28% | 4,541 | 76.27% | 27 | 0.45% | 5,954 |
| Union | 1,092 | 40.34% | 1,429 | 52.79% | 186 | 6.87% | 2,707 |
| Venango | 2,157 | 50.52% | 2,041 | 47.80% | 72 | 1.69% | 4,270 |
| Warren | 1,231 | 36.52% | 2,091 | 62.03% | 49 | 1.45% | 3,371 |
| Washington | 4,288 | 48.78% | 4,237 | 48.20% | 265 | 3.01% | 8,790 |
| Wayne | 2,259 | 49.71% | 2,172 | 47.80% | 113 | 2.49% | 4,544 |
| Westmoreland | 5,172 | 54.09% | 4,091 | 42.78% | 299 | 3.13% | 9,562 |
| Wyoming | 1,171 | 49.14% | 1,138 | 47.75% | 74 | 3.11% | 2,383 |
| York | 6,876 | 58.83% | 511 | 4.37% | 4,301 | 36.80% | 11,688 |
| Totals | 230,700 | 50.11% | 147,510 | 32.04% | 82,176 | 17.85% | 460,386 |
Analysis
[edit]Following the election, Pennsylvania would establish itself as a Republican stronghold. This would be the final time that Pennsylvania would vote for a Democratic candidate until Franklin D. Roosevelt won the state in 1936, as well as the last time that the state voted for a non-Republican candidate until Theodore Roosevelt’s third-party bid in 1912. Along with this being the last time that a non-incumbent Democrat won the state until John F. Kennedy in 1960.
As of the 2020 presidential election, this is the only time Snyder County voted for a Democratic presidential candidate.[3] Lebanon County has voted for the Democratic presidential candidate once since, in 1936. Blair, Dauphin, and Philadelphia counties would not vote Democratic again until 1936, and Delaware County until 1964. Lancaster, Huntingdon, and Somerset counties have voted for a Democrat once since, in 1964.
This is the first time Adams county voted for a Democratic party candidate, though it did vote for Andrew Jackson in 1824, who would be the party's first two nominees in 1828 and 1832.
This remains the only presidential election in history in which New York voted Republican while its neighboring state, Pennsylvania, voted Democratic. This is also one of only four occasions where Pennsylvania and Michigan voted for different presidential candidates ever since the Democrats and Republicans became the two major parties in U.S. politics.[4][a]
See also
[edit]Notes
[edit]References
[edit]- ^ "1856 Presidential General Election Results – Pennsylvania". U.S. Election Atlas. Retrieved August 3, 2012.
- ^ "Our Campaigns - PA US President Race - Nov 04, 1856". www.ourcampaigns.com. Retrieved January 9, 2025.
- ^ Menendez, Albert J.; The Geography of Presidential Elections in the United States, 1868-2004, pp. 286-290 ISBN 0786422173
- ^ Brownstein, Ronald (September 16, 2024). "Why these three states are the most consistent tipping point in American politics". CNN. Retrieved September 16, 2024.


