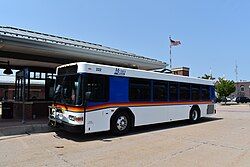
Metro Ride
 | |
 | |
| Parent | City of Wausau |
|---|---|
| Headquarters | 420 Plumer Street[1] |
| Locale | Wausau, Wisconsin |
| Service type | Bus service, Paratransit |
| Routes |
|
| Stations | Metro Ride Transit Center 555 Jefferson Street |
| Fleet | 22 Gillig transit coaches |
| Annual ridership | 337,884 (2022) |
| Website | [1] |
Metro Ride provides public bus transportation for the Wausau, Wisconsin area.
Metro Ride operates 7 routes in the City of Wausau which run at 30-minute intervals. The service also provides several express routes to supplement the main routes when school is in session.
Hours of operation are 6:30 a.m. to 6:30 p.m. Monday through Friday. Buses do not operate on Saturdays or Sundays. The main transfer facility is located in the downtown area, one block from the Marathon County Courthouse. The Wausau Transit Center at 555 Jefferson Street was upgraded and expanded in 2005.[2] This location also serves intercity buses.
- Metro Ride was formerly known as "Wausau Area Transit System (WATS)" The name now exists in the tagline "Provided by Wausau Area Transit System"
Route list
[edit]- A- Grand Ave/Health Center
- B- North 1st Ave/Northcentral Technical College
- D- Bridge St/West High School
- G- Sherman St
- H- North 6th St/Riverview
- I- Stewart Ave/Aspirus Hospital
- J- Thomas St
Service to Rothschild, Schofield and Weston ended in 2015, along with weekend service. At the same time, fares were raised.[3]
Fares
[edit]In 2022, fares are $1.75 for adults, $1.50 for students, $0.85 for seniors, and free for children. Adult fares have been increased from $1.25 in 2015. Additional fare increases had taken place in 2008 and 2012.
Wausau Transit Center
[edit]The Wausau Transit Center is located at 555 Jefferson Street in downtown Wausau across from the Marathon County Courthouse. The facility replaced a 1976 transit center located on the adjacent lot to the west of the current center.[4] The new facility was built in 2005 and has space for about 10 buses. All routes operate from the transit center, where intercity buses from Milwaukee, Janesville and Minneapolis also stop.[5][6]
Ridership
[edit]| Fixed Route Ridership | Paratransit Ridership | Total Ridership | Change over previous year | |
|---|---|---|---|---|
| 1999[7] | 849,843 | 21,657 | 871,500 | n/a |
| 2000[7] | 827,930 | 23,982 | 851,912 | |
| 2001[7] | 805,668 | 21,539 | 827,207 | |
| 2002[7] | 758,583 | 20,876 | 779,459 | |
| 2003[7] | 725,188 | 18,076 | 743,264 | |
| 2004[7] | 746,239 | 11,822 | 758,061 | |
| 2010[8] | 773,991 | 8,064 | 782,055 | |
| 2011[8] | 778,748 | 8,697 | 787,445 | |
| 2012[8] | 631,360 | 3,370 | 634,730 | |
| 2013[8] | 672,224 | 3,388 | 675,612 | |
| 2014[8] | 654,078 | 3,303 | 657,381 | |
| 2015[8] | 577,044 | 2,504 | 579,548 | |
| 2016[8] | 529,831 | 3,021 | 532,852 | |
| 2017[9] | 498,902 | 4,152 | 503,054 | |
| 2018[10] | 503,359 | 3,841 | 507,200 | |
| 2019[11] | 468,555 | 4,120 | 472,675 | |
| 2020[12] | 252,812 | 1,683 | 254,495 | |
| 2021[13] | 284,378 | 3,050 | 287,428 | |
| 2022[14] | 337,884 | 3,273 | 341,157 | |
| 2023[15] | 359,363 | 2,937 | 362,300 |
Fixed Route Service Trends
[edit]| Service Hours | Service Miles | |
|---|---|---|
| 1996 | 38,541 | 553,916 |
| 1997 | 37,562 | 557,047 |
| 1998 | 37,920 | 558,796 |
| 1999 | 38,827 | 564,311 |
| 2000 | 38,327 | 556,607 |
| 2001 | 37,961 | 556,023 |
| 2002 | 37,929 | 557,007 |
| 2003 | 37,946 | 556,501 |
| 2004 | 38,315 | 555,801 |
| 2005 | 37,596 | 535,183 |
| 2006 | 41,100 | 588,475 |
| 2007 | 40,776 | 578,288 |
| 2008 | 40,925 | 569,706 |
| 2009 | 38,738 | 540,514 |
| 2010 | 37,621 | 542,404 |
| 2011 | 38,740 | 543,846 |
| 2012 | 26,729 | 375,988 |
| 2013 | 29,372 | 411,843 |
| 2014 | 29,854 | 404,710 |
| 2015 | 27,028 | 375,626 |
| 2016 | 26,722 | 376,478 |
| 2017 | 27,324 | 377,052 |
| 2018 | 26,502 | 376,034 |
| 2019 | 26,407 | 376,816 |
| 2020 | 23,621 | 343,693 |
| 2021 | 27,017 | 381,209 |
| 2022 | 27,150 | 375,959 |
1996-2016 data from 2018 Wausau Transit Development Plan.[3] 2017-2020 data from National Transit database.[16]
See also
[edit]References
[edit]- ^ City of Wausau Transit System
- ^ "Metro Ride Transit Development Plan May 2012" (PDF).
- ^ a b "Wausau Metro Area Transit Development Program May 2018" (PDF).
- ^ "38 years ago: Wausau bus service 'needs friends'".
- ^ "Metro Ride Transit Development Plan May 2012" (PDF).
- ^ "Wausau Area Transit System Transit Development Plan May 2006" (PDF).
- ^ a b c d e f "Wausau TDP 2006" (PDF).
- ^ a b c d e f g "Wausau TDP 2018" (PDF).
- ^ "2017 Annual Agency Profile" (PDF).
- ^ "2018 Annual Agency Profile" (PDF).
- ^ "2019 Annual Agency Profile" (PDF).
- ^ "2020 Annual Agency Profile" (PDF).
- ^ "2021 Annual Agency Profile" (PDF).
- ^ "2022 Annual Agency Profile" (PDF).
- ^ "2023 Annual Agency Profile" (PDF).
- ^ "City of Wausau, Wisconsin | FTA".
