Lavillatte
You can help expand this article with text translated from the corresponding article in French. (December 2008) Click [show] for important translation instructions.
|
Lavillatte | |
|---|---|
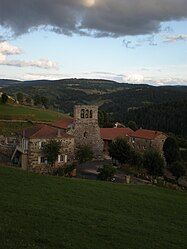
 The church and surrounding buildings in Lavillatte | |
| Coordinates: 44°44′42″N 3°57′12″E / 44.745°N 3.9533°E | |
| Country | France |
| Region | Auvergne-Rhône-Alpes |
| Department | Ardèche |
| Arrondissement | Largentière |
| Canton | Haute-Ardèche |
| Government | |
| • Mayor (2020–2026) | Marylaine Mercier[1] |
Area 1 | 18.6 km2 (7.2 sq mi) |
| Population (2022)[2] | 43 |
| • Density | 2.3/km2 (6.0/sq mi) |
| Time zone | UTC+01:00 (CET) |
| • Summer (DST) | UTC+02:00 (CEST) |
| INSEE/Postal code | 07137 /07660 |
| Elevation | 1,060–1,405 m (3,478–4,610 ft) (avg. 1,140 m or 3,740 ft) |
| 1 French Land Register data, which excludes lakes, ponds, glaciers > 1 km2 (0.386 sq mi or 247 acres) and river estuaries. | |
Lavillatte (French pronunciation: [lavilat]; Occitan: La Vilata) is a commune in the Ardèche department in southern France. It is in the Auvergne-Rhône-Alpes region.
Inhabitants are known as Viallatins and Viallatines.
Geography
[edit]Location and description
[edit]Lavillatte is 15 kilometers from Langogne, 40 kilometers from Le Puy-en-Velay, and 50 kilometeres from Aubenas. It is included in the canton of Coucouron, the Arrondissement of Largentière, and the department of Ardèche. The municipality has 1,860 hectares, including 660 hectares of forest.
Bordering communes
[edit]- Saint-Paul-de-Tartas (Haute-Loire)
- Coucouron
- Issanlas
- Lespéron
- Lanarce
- Saint-Alban-en-Montagne
- Le Plagnal
- Astet
Climate
[edit]In 2010, the French National Centre for Scientific Research concluded that the commune had a mountain climate.[3] Météo-France's 2020 typology of French climates concluded that Lavillatte is exposesd to a mountain or mountain margin climate, and is situated in the South East of Massif Central climatic region. This region is characterized by annual rainfall of 1,000 to 1,500 mm, minimal in the summer and heaviest in the fall.[4]
Population
[edit]| Year | Pop. | ±% p.a. |
|---|---|---|
| 1968 | 134 | — |
| 1975 | 103 | −3.69% |
| 1982 | 101 | −0.28% |
| 1990 | 98 | −0.38% |
| 1999 | 87 | −1.31% |
| 2007 | 78 | −1.36% |
| 2012 | 78 | +0.00% |
| 2017 | 57 | −6.08% |
| Source: INSEE[5] | ||
See also
[edit]References
[edit]- ^ "Répertoire national des élus: les maires". data.gouv.fr, Plateforme ouverte des données publiques françaises (in French). 9 August 2021.
- ^ (in French). The National Institute of Statistics and Economic Studies. 19 December 2024 https://www.insee.fr/fr/statistiques/8288323?geo=COM-07137.
{{cite web}}: Missing or empty|title=(help) - ^ Joly, Daniel; Brossard, Thierry; Cardot, Hervé; Cavailhes, Jean; Hilal, Mohamed; Wavresky, Pierre (18 June 2010). "Les types de climats en France, une construction spatiale". Cybergeo: European Journal of Geography (in French). doi:10.4000/cybergeo.23155. ISSN 1278-3366.
- ^ "Zonages climatiques en France métropolitaine". pluiesextremes.meteo.fr.[dead link]
- ^ Population en historique depuis 1968, INSEE


