Grafana
This article needs additional citations for verification. (March 2024) |
 | |
 | |
| Developer(s) | Grafana Labs |
|---|---|
| Stable release | 11.4.0[1]
/ 5 December 2024 |
| Repository | |
| Written in | Go and TypeScript |
| Operating system | Microsoft Windows, Linux, macOS |
| Type | Business intelligence |
| License | GNU Affero General Public License, version 3.0 |
| Website | grafana |
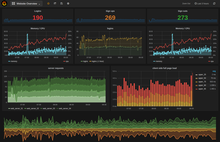
Grafana is a multi-platform open source analytics and interactive visualization web application. It can produce charts, graphs, and alerts for the web when connected to supported data sources.
There is also a licensed Grafana Enterprise version with additional capabilities, which is sold as a self-hosted installation or through an account on the Grafana Labs cloud service.[2] It is expandable through a plug-in system. Complex monitoring dashboards[3] can be built by end users, with the aid of interactive query builders. The product is divided into a front end and back end, written in TypeScript and Go, respectively.[4]
As a visualization tool, Grafana can be used as a component in monitoring stacks,[5] often in combination with time series databases such as InfluxDB, Prometheus[6][7] and Graphite;[8] monitoring platforms such as Sensu,[9] Icinga, Checkmk,[10] Zabbix, Netdata,[7] and PRTG; SIEMs such as Elasticsearch,[6] OpenSearch,[11] and Splunk; and other data sources. The Grafana user interface was originally based on version 3 of Kibana.[12]
History
[edit]Grafana was first released in 2014 by Torkel Ödegaard as an offshoot of a project at Orbitz. It targeted time series databases such as InfluxDB, OpenTSDB, and Prometheus, but evolved to support relational databases such as MySQL/MariaDB, PostgreSQL and Microsoft SQL Server.[13]
In 2019, Grafana Labs secured $24 million in Series A funding.[14] In the 2020 Series B funding round it obtained $50 million.[15] In the 2021 Labs Series C funding round, Grafana secured $220 million.[16]
Grafana Labs acquired Kausal in 2018,[17] k6[18][19] and Amixr[20] in 2021, and Asserts.ai in 2023.[21]
Adoption
[edit]Grafana is used[5] in Wikimedia's infrastructure.[22] Grafana has over 1000 paying customers, including Bloomberg, JP Morgan Chase, and eBay.[18]
Licensing
[edit]Previously, Grafana was licensed with an Apache License 2.0 license and used a CLA based on the Harmony Contributor Agreement.[23]
Since 2021, Grafana has been licensed under an AGPLv3 license.[24] Contributors to Grafana need to sign a Contributor License Agreement (CLA) that gives Grafana Labs the right to relicense Grafana in the future. The CLA is based on The Apache Software Foundation Individual Contributor License Agreement.[25]
Related projects
[edit]Grafana Labs launched a series of related open-source projects to complement Grafana:
- Grafana Loki - a log aggregation platform inspired by Prometheus first made available in 2019[26]
- Grafana Mimir - a Prometheus-compatible, scalable metrics storage and analysis tool released in 2022 that replaced Cortex[27]
- Grafana Tempo - a distributed tracing tool, released in 2021[28]
- Grafana Pyroscope - a continuous profiling tool, released in 2023[29]
References
[edit]- ^ "Release 11.4.0". 5 December 2024. Retrieved 23 December 2024.
- ^ "Grafana Enterprise Stack". Grafana Labs. Retrieved 2021-03-19.
- ^ Perrin, Jim. "Monitoring Linux performance with Grafana". OpenSource.com. Retrieved 2018-08-14.
- ^ Synopsys. "The grafana Open Source Project on Open Hub: Languages Page". Open Hub. Retrieved 2021-03-19.
- ^ a b Anadiotis, George. "DevOps and observability in the 2020s". ZDNet. Retrieved 2020-02-04.
- ^ a b Jones, Anna (2019-01-25). "Open Source Monitoring Stack: Prometheus and Grafana". Bizety. Retrieved 2019-05-08.
- ^ a b DeLosSantos, Louis (2018). "Netdata, Prometheus, Grafana stack". Netdata Documentation. Retrieved 2019-05-08.
- ^ Assaraf, Ariel (6 July 2018). "Grafana Vs Graphite". Coralogix.
- ^ Kumar, Santhosh; Muruganantham, Logeshkumar (2017-01-21). "Step By Step: Install and Configure Sensu + Grafana". Powerupcloud Tech Blog. Archived from the original on May 8, 2019. Retrieved 2019-05-08.
- ^ "Exporting Check_MK Performance Data to Grafana". TruePath Technologies. 2018. Retrieved 2020-09-24.
- ^ "OpenSearch plugin for Grafana". Grafana Labs. Retrieved 2024-06-02.
- ^ Ödegaard, Torkel (2019-09-03). "The (Mostly) Complete History of Grafana UX". grafana.com. Retrieved 2020-10-06.
- ^ "MySQL data source | Grafana documentation". Grafana Labs. Retrieved 2024-04-23.
- ^ Anadiotis, George. "Is open source the way to go for observability? Grafana Labs scores $24M Series A funding to try to prove this". ZDNet. Retrieved 2020-02-04.
- ^ Grafana (2020-08-17). "Grafana Labs Raises $50 Million to Accelerate R&D Investments in Open Source Logs, Metrics and Composable Observability". GlobeNewswire News Room (Press release). Retrieved 2021-07-23.
- ^ Grafana (2021-08-24). "Grafana Labs Raises $220 Million Round at $3 Billion Valuation". Bloomberg. Retrieved 2021-08-22.
- ^ "Kausal to join Grafana Labs to bring Prometheus to the masses". Kausal.co. 2018-03-10. Retrieved 2024-05-27.
- ^ a b "Grafana Labs acquires load-testing startup K6". VentureBeat. 2021-06-17. Retrieved 2021-07-27.
- ^ "Grafana Labs Acquires k6 to Add Open Source Load Testing Tool - DevOps.com". devops.com. 17 June 2021. Retrieved 2021-07-27.
- ^ "Russian-founded incident management tool Amixr acquired by US major Grafana Labs". ewdn.com. 2021-11-12. Retrieved 2021-11-12.
- ^ "Grafana Labs acquires AI startup Asserts.ai to ease application observability headaches". siliconangle.com. 2023-11-14. Retrieved 2024-06-14.
- ^ "grafana.wikimedia.org". Wikitech. Retrieved 2021-04-09.
- ^ "Grafana Labs Contributor License Agreement". Retrieved 2021-01-22.
- ^ Dutt, Raj (2021-04-20). "Grafana, Loki, and Tempo will be relicensed to AGPLv3". grafana.com. Retrieved 2021-04-21.
- ^ "Grafana Labs Contributor License Agreement". grafana.com. 2021-04-20. Retrieved 2021-04-21.
- ^ Lobo, Savia (November 20, 2019). "Grafana Labs announces general availability of Loki 1.0, a multi-tenant log aggregation system". Packt Hub. Retrieved 19 April 2023.
- ^ Gain, B. Cameron (August 10, 2022). "The Great Grafana Mimir and Cortex Split". The New Stack. Retrieved 19 April 2023.
- ^ Deutscher, Maria (June 8, 2021). "Grafana Labs eases IT monitoring with Tempo tracing tool and new Grafana release". Silicon Angle. Retrieved 19 April 2023.
- ^ Vizard, Mike (August 31, 2023). "Grafana Labs Delivers Open Source Code Profiling Tool". DevOps.com. Retrieved 27 May 2024.
