Jump to content

File:Bevölkerungsentwicklung Bad Liebenwerda.pdf

Page contents not supported in other languages.
This is a file from the Wikimedia Commons
From Wikipedia, the free encyclopedia

Original file (1,752 × 1,239 pixels, file size: 120 KB, MIME type: application/pdf)

File:Bevölkerungsentwicklung Bad Liebenwerda.svg is a vector version of this file. It should be used in place of this PDF file when not inferior.

File:Bevölkerungsentwicklung Bad Liebenwerda.pdf → File:Bevölkerungsentwicklung Bad Liebenwerda.svg

For more information, see Help:SVG.

In other languages
Alemannisch  العربية  беларуская (тарашкевіца)  български  বাংলা  català  нохчийн  čeština  dansk  Deutsch  Ελληνικά  English  British English  Esperanto  español  eesti  euskara  فارسی  suomi  français  Frysk  galego  Alemannisch  עברית  hrvatski  magyar  հայերեն  Bahasa Indonesia  Ido  italiano  日本語  ქართული  한국어  lietuvių  македонски  മലയാളം  Bahasa Melayu  norsk bokmål  Plattdüütsch  Nederlands  norsk nynorsk  norsk  occitan  polski  prūsiskan  português  português do Brasil  română  русский  sicilianu  Scots  slovenčina  slovenščina  српски / srpski  svenska  தமிழ்  ไทย  Türkçe  татарча / tatarça  українська  vèneto  Tiếng Việt  中文  中文(中国大陆)  中文(简体)  中文(繁體)  中文(马来西亚)  中文(新加坡)  中文(臺灣)  中文(臺灣)  +/−
New SVG image

Summary

Description
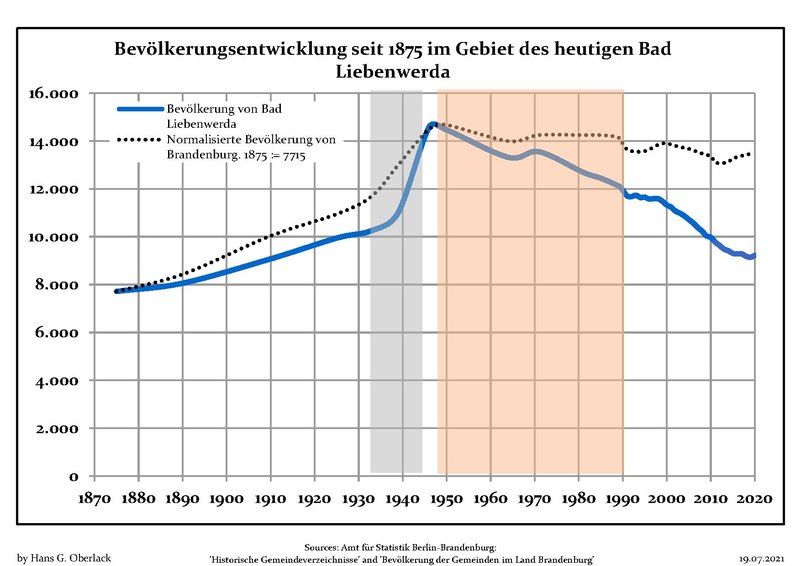
Deutsch: Bevölkerungsentwicklung in den heutigen Grenzen von Bad Liebenwerda , Landkreis Elbe-Elster, Land Brandenburg, Deutschland
Blaue Linie: Bevölkerung -- Punktierte Linie: Vergleich mit der Entwicklung Brandenburgs
Grauer Hintergrund: Zeit der Nazi-Herrschaft -- Roter Hintergrund: DDR-Zeit
English: Population development within the current boundaries of Bad Liebenwerda, Elbe-Elster district, Brandenburg state, Germany
Blue line: Population -- Dotted line: Comparison to population development of Brandenburg state
Grey background: Time of nazi rule -- Red background: Time of communist rule
Español: Desarrollo de la población en los actuales límites de Bad Liebenwerda, distrito de Elbe-Elster, estado de Brandenburg, Alemania
Línea azul: Habitantes -- Línea de puntos: Comparación con el desarrollo de Brandenburgo
Fondo gris: Período del gobierno nazi -- Fondo Rojo: Época communista
Français : Développement de la population dans les limites actuelles de Bad Liebenwerda, arrondissement de Elbe-Elster, Land de Brandebourg, Allemagne
Ligne bleue: Population -- Ligne pointillé: Comparaison avec le développement de Brandebourg
Fond gris: Période du régime nazie -- Fond rouge: Période du régime communiste
Italiano: Sviluppo della popolazione entro gli attuali confini de Bad Liebenwerda, circondario de Elbe-Elster, stato federato de Brandeburgo, Germania
Linea Blu: Popolazione -- Linea puntata: Confronto dello sviluppo della popolazione dello stato del Brandenburgo
Sfondo grigio: Ai tempi del governo nazista -- Sfondo rosso: Al tempo del governo comunista
Nederlands: Ontwikkeling van de bevolking binnen de huidige grenzen van Bad Liebenwerda, landkreis Elbe-Elster, deelstaat Brandenburg, Duitsland
Blauwe lijn: Bevolking -- Stippellijn: Vergelijking van de ontwikkeling van de bevolking van de deelstaat Brandenburg
Grijze achtergrond: tijdens de nazi-regering -- Rode achtergrond: tijdens de communistische regering
Polski: Rozwój ludności w obecnych granicach dla Bad Liebenwerda, powiat Elbe-Elster, kraj Brandenburgia, Niemcy
Niebieska linia: Populacja -- Linia przerywana: Porównanie z rozwoju Brandenburgii
Szare tło: Okres hitlerowców -- Czerwone tło: Okres rządów komunistycznych
Svenska: Befolkningsutvecklingen i de nuvarande gränserna för Bad Liebenwerda, landkreis Elbe-Elster, delstaten Brandenburg, Tyskland
Blå linje: Befolkning -- Prickade linjen: Jämförelse med utvecklingen av Brandenburg
Grå bakgrund: Period av Nazi styre -- Röd bakgrund: Period av kommunistiskt styre
Date between 1 May 2012 and 19 July 2021
date QS:P,+2050-00-00T00:00:00Z/7,P1319,+2012-05-01T00:00:00Z/11,P1326,+2021-07-19T00:00:00Z/11
Source Own work based on: Data sources displayed at Population Projection Brandenburg at Wikimedia Commons
Author Hans G. Oberlack
Latest population data
InfoField
2020
Object location51° 30′ 57.44″ N, 13° 23′ 38.9″ E Kartographer map based on OpenStreetMap.View this and other nearby images on: OpenStreetMapinfo

Licensing

I, the copyright holder of this work, hereby publish it under the following license:
w:en:Creative Commons
attribution share alike
This file is licensed under the Creative Commons Attribution-Share Alike 3.0 Unported license.
You are free:
  • to share – to copy, distribute and transmit the work
  • to remix – to adapt the work
Under the following conditions:
  • attribution – You must give appropriate credit, provide a link to the license, and indicate if changes were made. You may do so in any reasonable manner, but not in any way that suggests the licensor endorses you or your use.
  • share alike – If you remix, transform, or build upon the material, you must distribute your contributions under the same or compatible license as the original.

Captions

Add a one-line explanation of what this file represents

1 May 2012

51°30'57.438"N, 13°23'38.900"E

application/pdf

8a73b509b582af18c2a243467710943ab8956fc6

122,915 byte

1,239 pixel

1,752 pixel

File history

Click on a date/time to view the file as it appeared at that time.

Date/TimeThumbnailDimensionsUserComment
current21:47, 19 July 2021Thumbnail for version as of 21:47, 19 July 20211,752 × 1,239 (120 KB)Hans G. Oberlack2017, 2018, 2019, 2020 data added
22:41, 28 January 2018No thumbnail0 × 0 (119 KB)Hans G. Oberlack2016 data added
14:33, 30 January 2017No thumbnail0 × 0 (118 KB)Hans G. Oberlack2015 data added
23:01, 1 July 2015No thumbnail0 × 0 (97 KB)Hans G. OberlackGraphics adjusted to recent data
21:23, 1 May 2012No thumbnail0 × 0 (97 KB)Hans G. Oberlack

The following page uses this file:

Global file usage

The following other wikis use this file:

Metadata