User:Jarda2020/2022–23 South Pacific cyclone season
| 2022–23 South Pacific cyclone season | |
|---|---|
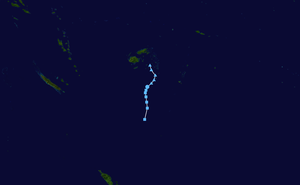
 Season summary map | |
| Seasonal boundaries | |
| First system formed | July 2, 2022 (record earliest) |
| Last system dissipated | Season ongoing |
| Strongest storm | |
| Name | Hale |
| • Maximum winds | 75 km/h (45 mph) (10-minute sustained) |
| • Lowest pressure | 990 hPa (mbar) |
| Seasonal statistics | |
| Total disturbances | 3 |
| Total depressions | 3 |
| Tropical cyclones | 1 |
| Severe tropical cyclones | 0 |
| Total fatalities | None |
| Total damage | Unknown |
| Related articles | |
The 2022–23 South Pacific cyclone season is the period of the year when most tropical cyclones form within the South Pacific Ocean to the east of 160°E. The season officially started on November 1, 2022, and will end on April 30, 2023, however a tropical cyclone could form at any time between July 1, 2022, and June 30, 2023, and would count towards the season total. During the season, tropical cyclones will be officially monitored by the Fiji Meteorological Service, Australian Bureau of Meteorology and New Zealand's MetService. The United States Armed Forces through the Joint Typhoon Warning Center (JTWC) will also monitor the basin and issue unofficial warnings for American interests. The FMS attaches a number and an F suffix to tropical disturbances that form in or move into the basin while the JTWC designates significant tropical cyclones with a number and a P suffix. The BoM, FMS and MetService all use the Australian Tropical Cyclone Intensity Scale and estimate windspeeds over a period of ten minutes, while the JTWC estimated sustained winds over a 1-minute period, which are subsequently compared to the Saffir–Simpson hurricane wind scale (SSHWS).
Seasonal forecasts
[edit]During July 2022, the Centre for Water, Climate and Land (CWCL) at Australia's Newcastle University, issued its first long-range tropical cyclone outlook for the 2022–23 season. Within the outlook, the CWCL took into account the persistent La Niña like conditions across the Tropical Pacific Ocean, that were expected to continue and the modelled sea surface temperatures over the Indian Ocean, which pointed towards a negative Indian Ocean Dipole event occurring. As a result, they predicted that the South Pacific region between 135°E and 120°W, would see a near-normal tropical cyclone season, with between six and nine tropical cyclones occurring during the season.
They also predicted that French Polynesia, Niue, Northern New Zealand, Papua New Guinea, Tokelau, Tonga, Tuvalu, Wallis & Futuna, the Cook, Samoan and Pitcairn Islands, had a below normal of being impacted by a tropical cyclone. Fiji, New Caledonia and the Solomon Islands were thought to have a near-normal chance of being impacted by one or more tropical cyclones, while Vanuatu was expected to face an above-normal chance of being impacted by one or more tropical cyclones. The CWCL subsequently updated its forecast during August and predicted that the Solomon Islands and Vanuatu, would face a below-normal risk of being impacted by one or more tropical cyclones. They also predicted that Papua New Guinea now faced an above-average chance of being impacted by one or more tropical cyclones. During October, the CWCL issued their final outlook before the cyclone season started and noted that the Solomon Islands, Northern New Zealand and Vanuatu, now faced a near-normal risk of being impacted by one or more tropical cyclones.
New Zealand's National Institute of Water and Atmospheric Research (NIWA) subsequently published the Southwest Pacific Tropical Cyclone Outlook, which took into account CWCL's tropical cyclone outlooks, as well as the El Niño-Southern Oscillation conditions that were present over the basin and forecast to occur during the season. The outlook called for a near-average number of tropical cyclones for the 2022–23 season, with six to ten named tropical cyclones, predicted to occur between 135°E and 120°W, compared to an average of just under 9. Three or four of the tropical cyclones were expected to intensify further and become severe tropical cyclones, while it was noted that a Category 5 severe tropical cyclone could occur during the season.
BoM
[edit]The BoM issued two seasonal forecasts for the Southern Pacific Ocean, for their self-defined eastern and western regions of the South Pacific Ocean. They predicted that the Western region between 142.5°E and 165°E, had a 65% chance of seeing more than 4 tropical cyclones, while the Eastern Region between 165°E and 120°W, had a 43% chance of seeing more than 6 tropical cyclones.
Seasonal summary
[edit]
Systems
[edit]Tropical Depression 01F
[edit]| Tropical depression (Australian scale) | |
| Tropical storm (SSHWS) | |
| Duration | July 2 – July 8 |
|---|---|
| Peak intensity | 75 km/h (45 mph) (1-min); 998 hPa (mbar) |
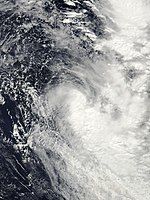
The first tropical depression of the season was first noted as a tropical disturbance during July 2, while it was located about 920 km (570 mi) to the north-northeast of Honiara in the Solomon Islands. The system lay to the north of an upper level subtropical ridge of high pressure in an area of moderate vertical wind shear. Over the next couple of days the system slowly organised further as it steered south-eastwards into an area of decreasing vertical wind shear. As a result of further organization it was classified as a tropical depression during July 5. Late on July 8, the FMS issued its final advisory on the system as it reported that the system was not expected to develop.
Tropical Depression 02F
[edit]| Tropical depression (Australian scale) | |
| Tropical storm (SSHWS) | |
| Duration | August 31 – September 6 |
|---|---|
| Peak intensity | 55 km/h (35 mph) (10-min); 1000 hPa (mbar) |
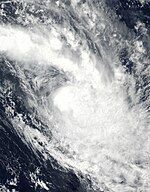
A tropical depression developed between Vanuatu to the east and Fiji to the west on August 31. The initially disorganized system intensified until it reached its initial peak intensity of 45 knots while accelerating north. Immediately after, however, strong shear weakened the system, causing it to become disorganized again. On September 3, the system began to organize again, and the JTWC upgraded the system to Tropical Cyclone 02P as it neared landfall on Fiji before crossing the International Date Line. The cyclone later reached its secondary peak intensity of 40 knots before it underwent extratropical transition, a process that completed during the early hours of September 7.
Tropical Cyclone Hale
[edit]| Category 1 tropical cyclone (Australian scale) | |
| Tropical storm (SSHWS) | |
| Duration | October 21 – October 29 |
|---|---|
| Peak intensity | 75 km/h (45 mph) (10-min); 990 hPa (mbar) |
On October 21, RSMC Nadi reported that Tropical Disturbance 03F had developed about 250 km (155 mi) to the southeast of Pago Pago, American Samoa. Over the next few days the system gradually developed further before early on October 28, RSMC Nadi reported the system had become a category 1 tropical cyclone on the Australian scale and named it Hale. The JTWC subsequently initiated advisories on the system and assigned it the designation Tropical Cyclone 03P. Later that day RSMC Nadi and the JTWC issued their final advisories on Mike, as it moved below 25S and transitioned into an extratropical cyclone. The extra-tropical remnants of the cyclone were subsequently monitored by TCWC Wellington, until they were last noted during November 2, while they were located over 1,700 km (1,055 mi) to the east of Wellington, New Zealand.
Storm names
[edit]Within the Southern Pacific, a tropical depression is judged to have reached tropical cyclone intensity should it reach winds of 65 km/h (40 mph) and it is evident that gales are occurring at least halfway around the center. With tropical depressions intensifying into a tropical cyclone between the Equator and 25°S and between 160°E - 120°W named by the FMS. However should a tropical depression intensify to the south of 25°S between 160°E and 120°W it will be named in conjunction with the FMS by MetService. Should a tropical cyclone move out of the basin and into the Australian region it will retain its original name. The next 10 names on the naming list are listed here below.
|
|
Season effects
[edit]This table lists all the storms that developed in the South Pacific to the east of longitude 160°E during the 2022–23 season. It includes their intensity on the Australian tropical cyclone intensity scale, duration, name, landfalls, deaths, and damages. All data is taken from RSMC Nadi and/or TCWC Wellington, and all of the damage figures are in 2022 or 2023 USD.
| Name | Dates | Peak intensity | Areas affected | Damage (USD) |
Deaths | Refs | ||
|---|---|---|---|---|---|---|---|---|
| Category | Wind speed | Pressure | ||||||
| 01F | July 2 – 8 | Tropical depression | 75 km/h (45 mph) | 998 hPa (29.47 inHg) | Solomon Islands, Vanuatu | None | None | |
| 02F | August 31 – September 6 | Tropical depression | 55 km/h (35 mph) | 1000 hPa (29.53 inHg) | Fiji | None | None | |
| Hale | October 21 – 29 | Category 1 tropical cyclone | 75 km/h (45 mph) | 990 hPa (29.23 inHg) | Cook Islands | Unknown | None | |
| Season aggregates | ||||||||
| 3 systems | July 2 – Season ongoing | 75 km/h (45 mph) | 990 hPa (30 inHg) | Unknown | 0 | |||
See also
[edit]- Weather of 2022 and 2023
- List of Southern Hemisphere cyclone seasons
- Tropical cyclones in 2022 and 2023
- Atlantic hurricane seasons: 2022, 2023
- Pacific hurricane seasons: 2022, 2023
- Pacific typhoon seasons: 2022, 2023
- North Indian Ocean cyclone seasons: 2022, 2023
- 2022–23 South-West Indian Ocean cyclone season
- 2022–23 Australian region cyclone season


