1940 United States Senate elections
| ||||||||||||||||||||||||||||||||||||||||||||||||||||||||||||||||||||||||||||||||||||||||||||||||||||||
34 of the 96 seats in the United States Senate 49 seats needed for a majority | ||||||||||||||||||||||||||||||||||||||||||||||||||||||||||||||||||||||||||||||||||||||||||||||||||||||
|---|---|---|---|---|---|---|---|---|---|---|---|---|---|---|---|---|---|---|---|---|---|---|---|---|---|---|---|---|---|---|---|---|---|---|---|---|---|---|---|---|---|---|---|---|---|---|---|---|---|---|---|---|---|---|---|---|---|---|---|---|---|---|---|---|---|---|---|---|---|---|---|---|---|---|---|---|---|---|---|---|---|---|---|---|---|---|---|---|---|---|---|---|---|---|---|---|---|---|---|---|---|---|
| ||||||||||||||||||||||||||||||||||||||||||||||||||||||||||||||||||||||||||||||||||||||||||||||||||||||
 Results of the elections: Democratic gain Democratic hold Republican gain Republican hold Progressive hold No election | ||||||||||||||||||||||||||||||||||||||||||||||||||||||||||||||||||||||||||||||||||||||||||||||||||||||
| ||||||||||||||||||||||||||||||||||||||||||||||||||||||||||||||||||||||||||||||||||||||||||||||||||||||
The 1940 United States Senate elections coincided with the election of Franklin D. Roosevelt to his third term as president. The 32 seats of Class 1 were contested in regular elections, and special elections were held to fill vacancies.
Although Roosevelt was re-elected, support for his administration had dropped somewhat after eight years, and the Republican opposition gained three seats from the Democrats. However, the New Deal Democrats regained firm control of both the House and Senate because Progressives dominated the election.[2] The Minnesota Farmer–Labor Party also disappeared from the Senate, as Henrik Shipstead joined the Republican party and Ernest Lundeen had died during the preceding term. Senator Harry S. Truman of Missouri was elected to his final term in the Senate in 1940. Truman resigned in 1945 to serve as President Roosevelt's third Vice President.
Republicans later gained an additional seat through an appointment in Colorado.
Gains, losses, and holds
[edit]Retirements
[edit]One Republican and two Democrats retired instead of seeking re-election. One Republican retired instead of seeking election to finish the unexpired term.
| State | Senator | Replaced by |
|---|---|---|
| Maine | Frederick Hale | Owen Brewster |
| Ohio | Vic Donahey | Harold H. Burton |
| Vermont (special) | Ernest W. Gibson Jr. | George Aiken |
| Washington | Lewis B. Schwellenbach | Monrad Wallgren |
Defeats
[edit]Five Democrats and two Republicans sought re-election but lost in the primary or general election. One Democrat sought election to finish the unexpired term but lost in the general election.
Post-election changes
[edit]Party switches
[edit]One Farmer-Labor senator was re-elected as a Republican.
| State | Senator | Replaced by |
|---|---|---|
| Minnesota | Henrik Shipstead | Henrik Shipstead |
Change in composition
[edit]Before the elections
[edit]| D1 | D2 | D3 | D4 | D5 | D6 | D7 | D8 | ||
| D18 | D17 | D16 | D15 | D14 | D13 | D12 | D11 | D10 | D9 |
| D19 | D20 | D21 | D22 | D23 | D24 | D25 | D26 | D27 | D28 |
| D38 | D37 | D36 | D35 | D34 | D33 | D32 | D31 | D30 | D29 |
| D39 | D40 | D41 | D42 | D43 | D44 | D45 Ariz. Ran |
D46 Conn. Ran |
D47 Fla. Ran |
D48 Ill. (sp) Ran |
| Majority → | D49 Ind. Ran | ||||||||
| D58 N.M. Ran |
D57 Nev. Ran |
D56 Neb. Ran |
D55 Mont. Ran |
D54 Mo. Ran |
D53 Miss. Ran |
D52 Mass. Ran |
D51 Md. Ran |
D50 Ky. (sp) Ran | |
| D59 N.Y. Ran |
D60 Ohio Ran |
D61 Pa. Ran |
D62 R.I. Ran |
D63 Tenn. Ran |
D64 Texas Ran |
D65 Utah Ran |
D66 Va. Ran |
D67 Wash. Retired |
D68 W.Va. Ran |
| R19 Maine Retired |
R20 Mich. Ran |
R21 N.J. Ran |
R22 N.D. Ran |
R23 Vt. (reg) Ran |
R24 Vt. (sp) Retired |
FL1 Minn. Ran |
P1 Wis. Ran |
I1 | D69 Wyo. Ran |
| R18 Idaho (sp) Ran |
R17 Del. Ran |
R16 Calif. Ran |
R15 | R14 | R13 | R12 | R11 | R10 | R9 |
| R1 | R2 | R3 | R4 | R5 | R6 | R7 | R8 | ||
Election results
[edit]| D1 | D2 | D3 | D4 | D5 | D6 | D7 | D8 | ||
| D18 | D17 | D16 | D15 | D14 | D13 | D12 | D11 | D10 | D9 |
| D19 | D20 | D21 | D22 | D23 | D24 | D25 | D26 | D27 | D28 |
| D38 | D37 | D36 | D35 | D34 | D33 | D32 | D31 | D30 | D29 |
| D39 | D40 | D41 | D42 | D43 | D44 | D45 Ariz. Hold |
D46 Conn. Re-elected |
D47 Fla. Re-elected |
D48 Ky. (sp) Elected[a] |
| Majority → | D49 Md. Re-elected | ||||||||
| D58 R.I. Re-elected |
D57 Pa. Re-elected |
D56 N.Y. Re-elected |
D55 N.M. Re-elected |
D54 Nev. Re-elected |
D53 Mont. Re-elected |
D52 Mo. Re-elected |
D51 Miss. Re-elected |
D50 Mass. Re-elected | |
| D59 Tenn. Re-elected |
D60 Texas Re-elected |
D61 Utah Hold |
D62 Va. Re-elected |
D63 Wash. Hold |
D64 W.Va. Hold |
D65 Wyo. Re-elected |
D66 Del. Gain |
I1 | P1 Wis. Re-elected |
| R19 Mich. Re-elected |
R20 N.J. Re-elected |
R21 N.D. Hold |
R22 Vt. (reg) Re-elected |
R23 Vt. (sp) Hold |
R24 Ill. (sp) Gain[b] |
R25 Ind. Gain |
R26 Minn. Re-elected under different party |
R27 Neb. Gain |
R28 Ohio Gain |
| R18 Maine Hold |
R17 Idaho (sp) Elected[a] |
R16 Calif. Re-elected |
R15 | R14 | R13 | R12 | R11 | R10 | R9 |
| R1 | R2 | R3 | R4 | R5 | R6 | R7 | R8 | ||
| Key |
|
|---|
Race summaries
[edit]Special elections during the 76th Congress
[edit]In these special elections, the winner elected during 1940 and seated once qualified; ordered by election date.
| State | Incumbent | Results | Candidates | ||
|---|---|---|---|---|---|
| Senator | Party | Electoral history | |||
| Idaho (Class 2) |
John Thomas | Republican | 1928 (appointed) 1928 (special) 1932 (lost) 1940 (appointed) |
Interim appointee elected November 5, 1940. |
|
| Illinois (Class 2) |
James M. Slattery | Democratic | 1939 (appointed) | Interim appointee lost election to finish term. New senator elected November 5, 1940. Republican gain. |
|
| Kentucky (Class 2) |
Happy Chandler | Democratic | 1939 (appointed) | Interim appointee elected November 5, 1940. |
|
| Vermont (Class 3) |
Ernest W. Gibson Jr. | Republican | 1940 (appointed) | Interim appointee retired. New senator elected November 5, 1940. Republican hold. |
|
Races leading to the 77th Congress
[edit]In these regular elections, the winners were elected for the term beginning January 3, 1941; ordered by state.
All of the elections involved the Class 1 seats.
| State | Incumbent | Results | Candidates | ||
|---|---|---|---|---|---|
| Senator | Party | Electoral history | |||
| Arizona | Henry F. Ashurst | Democratic | 1912 1916 1922 1928 1934 |
Incumbent lost renomination. New senator elected. Democratic hold. |
|
| California | Hiram Johnson | Republican | 1916 1922 1928 1934 |
Incumbent re-elected. |
|
| Connecticut | Francis T. Maloney | Democratic | 1934 | Incumbent re-elected. |
|
| Delaware | John G. Townsend Jr. | Republican | 1928 1934 |
Incumbent lost re-election. New senator elected. Democratic gain. |
|
| Florida | Charles O. Andrews | Democratic | 1936 (special) | Incumbent re-elected. |
|
| Indiana | Sherman Minton | Democratic | 1934 | Incumbent lost re-election. New senator elected. Republican gain. |
|
| Maine | Frederick Hale | Republican | 1916 1922 1928 1934 |
Incumbent retired. New senator elected. Republican hold. |
|
| Maryland | George L. P. Radcliffe | Democratic | 1934 | Incumbent re-elected. |
|
| Massachusetts | David I. Walsh | Democratic | 1918 1924 (lost) 1926 (special) 1928 1934 |
Incumbent re-elected. |
|
| Michigan | Arthur Vandenberg | Republican | 1928 (appointed) 1928 (special) 1928 1934 |
Incumbent re-elected. |
|
| Minnesota | Henrik Shipstead | Farmer–Labor | 1922 1928 1934 |
Incumbent re-elected as a Republican. Republican gain. |
|
| Mississippi | Theodore G. Bilbo | Democratic | 1934 | Incumbent re-elected. |
|
| Missouri | Harry S. Truman | Democratic | 1934 | Incumbent re-elected. |
|
| Montana | Burton K. Wheeler | Democratic | 1922 1928 1934 |
Incumbent re-elected. |
|
| Nebraska | Edward R. Burke | Democratic | 1934 | Incumbent lost renomination. New senator elected. Republican gain. |
|
| Nevada | Key Pittman | Democratic | 1913 (special) 1916 1922 1928 1934 |
Incumbent re-elected. Winner died November 10, 1940, and Berkeley L. Bunker (D) was appointed both to finish the term and to start the next term. |
|
| New Jersey | W. Warren Barbour | Republican | 1931 (appointed) 1932 (special) 1936 (lost) 1938 (special) |
Incumbent re-elected. |
|
| New Mexico | Dennis Chávez | Democratic | 1935 (appointed) 1936 (special) |
Incumbent re-elected. |
|
| New York | James M. Mead | Democratic | 1938 (special) | Incumbent re-elected. |
|
| North Dakota | Lynn Frazier | Republican/ Nonpartisan League |
1922 1928 1934 |
Incumbent lost renomination. New senator elected. Republican hold. |
|
| Ohio | Vic Donahey | Democratic | 1934 | Incumbent retired. New senator elected. Republican gain. |
|
| Pennsylvania | Joseph F. Guffey | Democratic | 1934 | Incumbent re-elected. |
|
| Rhode Island | Peter G. Gerry | Democratic | 1916 1922 1928 (lost) 1934 |
Incumbent re-elected. |
|
| Tennessee | Kenneth McKellar | Democratic | 1916 1922 1928 1934 |
Incumbent re-elected. |
|
| Texas | Tom Connally | Democratic | 1928 1934 |
Incumbent re-elected. |
|
| Utah | William H. King | Democratic | 1916 1922 1928 (lost) 1934 |
Incumbent lost renomination. New senator elected. Democratic hold. |
|
| Vermont | Warren Austin | Republican | 1931 (special) 1934 |
Incumbent re-elected. |
|
| Virginia | Harry F. Byrd | Democratic | 1933 (appointed) 1933 (special) 1934 |
Incumbent re-elected. |
|
| Washington | Lewis B. Schwellenbach | Democratic | 1934 | Incumbent retired. New senator elected. Democratic hold. Incumbent resigned December 16, 1940. Winner appointed to finish the term. |
|
| West Virginia | Rush Holt Sr. | Democratic | 1934 | Incumbent lost renomination. New senator elected. Democratic hold. |
|
| Wisconsin | Robert M. La Follette Jr. | Progressive | 1925 (special) 1928 1934 |
Incumbent re-elected. |
|
| Wyoming | Joseph C. O'Mahoney | Democratic | 1933 (appointed) 1934 |
Incumbent re-elected. |
|
Closest races
[edit]Thirteen races had a margin of victory under 10%:
| State | Party of winner | Margin |
|---|---|---|
| Illinois | Republican (flip) | 0.7% |
| Indiana | Republican (flip) | 1.4% |
| Missouri | Democratic | 2.5% |
| North Dakota | Republican | 3.0% |
| Delaware | Democratic (flip) | 3.3% |
| Wisconsin | Progressive | 3.9% |
| Pennsylvania | Democratic | 4.4% |
| Ohio | Republican (flip) | 4.8% |
| Michigan | Republican | 5.7% |
| Idaho (special) | Republican | 5.9% |
| New York | Democratic | 6.6% |
| Connecticut | Democratic | 7.5% |
| Washington | Democratic | 8.4% |
There is no tipping point state.
Arizona
[edit]
| |||||||||||||||||
| |||||||||||||||||
 County results McFarland: 60–70% 70–80% 80–90% | |||||||||||||||||
| |||||||||||||||||
| Party | Candidate | Votes | % | |
|---|---|---|---|---|
| Democratic | Ernest McFarland | 101,495 | 71.6 | |
| Republican | Irving A. Jennings Sr. | 39,657 | 28 | |
| Prohibition | A. Walter Gehres | 579 | 0.4 | |
| Majority | 61,838 | 43.63 | ||
| Turnout | 141,731 | |||
| Democratic hold | ||||
California
[edit]
| ||||||||||||||||||||
| ||||||||||||||||||||
 County results Johnson: 70–80% 80–90% >90% | ||||||||||||||||||||
| ||||||||||||||||||||
| Party | Candidate | Votes | % | |
|---|---|---|---|---|
| Republican | Hiram W. Johnson (Incumbent) | 2,238,899 | 82.50 | |
| Prohibition | Fred Dyster | 366,044 | 13.49 | |
| Communist | Anita Whitney | 97,478 | 3.59 | |
| Write-In | John Anson Ford | 7,415 | 0.27 | |
| None | Scattering | 4,029 | 0.15 | |
| Majority | 1,872,855 | 69.01 | ||
| Turnout | 2,713,865 | |||
| Republican hold | ||||
Connecticut
[edit]
| ||||||||||||||||||||
| ||||||||||||||||||||
Maloney: 40–50% 50–60% 60-70% Cornell: 50-60% 60-70% 70-80% | ||||||||||||||||||||
| ||||||||||||||||||||
| Party | Candidate | Votes | % | |
|---|---|---|---|---|
| Democratic | Francis T. Maloney (Incumbent) | 416,740 | 53.15 | |
| Republican | Paul L. Cornell | 358,313 | 45.70 | |
| Socialist | Kenneth W. Thurlow | 6,557 | 0.84 | |
| Socialist Labor | James A. Hutchin | 1,343 | 0,17 | |
| Communist | Isadore Wofsy | 1,114 | 0,14 | |
| Majority | 58,427 | 12.45 | ||
| Turnout | 784,067 | |||
| Democratic hold | ||||
Delaware
[edit]
| |||||||||||||||||
| |||||||||||||||||
 County results Tunnell: 50–60% | |||||||||||||||||
| |||||||||||||||||
| Party | Candidate | Votes | % | |
|---|---|---|---|---|
| Democratic | James M. Tunnell | 68,294 | 50.63 | |
| Republican | John G. Townsend Jr. (Incumbent) | 63,799 | 47.30 | |
| Independent Democratic | William F. Allen | 2,786 | 2.07 | |
| Majority | 4,495 | 3.33 | ||
| Turnout | 134,879 | |||
| Democratic gain from Republican | ||||
Florida
[edit]
| |||||||||||||||||
| |||||||||||||||||
 County results Andrews: 90–100% | |||||||||||||||||
| |||||||||||||||||
| Party | Candidate | Votes | % | |
|---|---|---|---|---|
| Democratic | Charles O. Andrews (Incumbent) | 323,216 | 100.00 | |
| Democratic hold | ||||
Idaho (special)
[edit]
| |||||||||||||||||
| |||||||||||||||||
 County results Thomas: 50-60% 60-70% 80-90% Taylor: 50–60% 60–70% | |||||||||||||||||
| |||||||||||||||||
| Party | Candidate | Votes | % | |
|---|---|---|---|---|
| Republican | John Thomas | 124,535 | 52.96 | |
| Democratic | Glen H. Taylor | 110,614 | 47.04 | |
| Majority | 13,921 | 5.92 | ||
| Turnout | 235,149 | |||
| Republican hold | ||||
Illinois (special)
[edit]
| |||||||||||||||||
| |||||||||||||||||
 Results by county Brooks: 40–50% 50–60% 60–70% 70–80% Slattery: 50–60% | |||||||||||||||||
| |||||||||||||||||
| Party | Candidate | Votes | % | |
|---|---|---|---|---|
| Republican | Charles W. Brooks | 2,045,924 | 50.07 | |
| Democratic | James M. Slattery (Incumbent) | 2,025,097 | 49.56 | |
| Prohibition | Enoch A. Holtwick | 8,625 | 0.21 | |
| Socialist | Clarence H. Mayer | 6,517 | 0.16 | |
| None | Scattering | 16 | 0.00 | |
| Majority | 20,827 | 0.51 | ||
| Turnout | 4,086,179 | |||
| Republican hold | ||||
Indiana
[edit]
| |||||||||||||||||
| |||||||||||||||||
 County results Willis: 50–60% 60–70% Minton: 40–50% 50–60% 60–70% | |||||||||||||||||
| |||||||||||||||||
| Party | Candidate | Votes | % | |
|---|---|---|---|---|
| Republican | Raymond E. Willis | 888,070 | 50.45 | |
| Democratic | Sherman Minton (Incumbent) | 864,803 | 49.13 | |
| Prohibition | Carl W. Thompson | 5,621 | 0.32 | |
| Socialist | John H. Kingsbury | 1,751 | 0.10 | |
| Majority | 23,267 | 1.32 | ||
| Turnout | 1,760,245 | |||
| Republican gain from Democratic | ||||
Kentucky (special)
[edit]
| Party | Candidate | Votes | % | |
|---|---|---|---|---|
| Democratic | Happy Chandler (Incumbent) | 561,151 | 58.27 | |
| Republican | Walter B. Smith | 401,812 | 41.73 | |
| Majority | 159,339 | 16.54 | ||
| Turnout | 962,963 | |||
| Democratic hold | ||||
Maine
[edit]
| |||||||||||||||||
| |||||||||||||||||
 County results Brewster: 50–60% 60–70% 70–80% Brann: 50–60% 60–70% | |||||||||||||||||
| |||||||||||||||||
| Party | Candidate | Votes | % | |
|---|---|---|---|---|
| Republican | Ralph Owen Brewster | 150,149 | 58.61 | |
| Democratic | Louis J. Brann | 105,740 | 41.27 | |
| Independent | Lewis Gordon | 305 | 0.12 | |
| Majority | 44,409 | 17.34 | ||
| Turnout | 256,194 | |||
| Republican hold | ||||
Maryland
[edit]
| |||||||||||||||||
| |||||||||||||||||
 County results Nice: 40–50% 50–60% Radcliffe: 40–50% 50–60% 60–70% | |||||||||||||||||
| |||||||||||||||||
| Party | Candidate | Votes | % | |
|---|---|---|---|---|
| Democratic | George L. P. Radcliffe (Incumbent) | 394,239 | 64.74 | |
| Republican | Harry W. Nice | 203,912 | 33.48 | |
| Socialist | Edwin B. Abbott | 4,204 | 0.69 | |
| Independent | David L. Elliott | 3,423 | 0.56 | |
| American Labor | Robert Kadish | 1,848 | 0.30 | |
| Communist | Albert E. Blumberg | 1,349 | 0.22 | |
| Majority | 190,327 | 31.26 | ||
| Turnout | 608,975 | |||
| Democratic hold | ||||
Massachusetts
[edit]
| |||||||||||||||||
| |||||||||||||||||
Walsh: 40–50% 50–60% 60–70% 70–80% Parkman: 40–50% 50–60% 60–70% 70–80% 80–90% | |||||||||||||||||
| |||||||||||||||||
| Party | Candidate | Votes | % | |
|---|---|---|---|---|
| Democratic | David I. Walsh (Incumbent) | 1,088,838 | 55.64 | |
| Republican | Henry Parkman Jr. | 838,122 | 42.38 | |
| Prohibition | George L. Thompson | 9,632 | 0.49 | |
| Communist | Philip Frankfeld | 9,465 | 0.48 | |
| Socialist | Lyman Paine | 6,876 | 0.35 | |
| Socialist Labor | Horace I. Hillis | 4,133 | 0.21 | |
| Majority | 250,716 | 12.82 | ||
| Turnout | 1,957,089 | |||
| Democratic hold | ||||
Michigan
[edit]
| |||||||||||||||||
| |||||||||||||||||
 County results Vandenberg: 40–50% 50–60% 60–70% 70–80% 80–90% FitzGerald: 50–60% 60–70% | |||||||||||||||||
| |||||||||||||||||
| Party | Candidate | Votes | % | |
|---|---|---|---|---|
| Republican | Arthur Vandenberg (Incumbent) | 1,053,104 | 52.65 | |
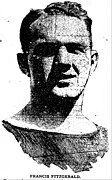
| Democratic | Frank FitzGerald | 939,740 | 46.98 | |
| Socialist | Nahum Burnett | 3,580 | 0.18 | |
| Communist | Elmer Johnson | 2,290 | 0.11 | |
| Prohibition | Carroll P. Pahman | 937 | 0.05 | |
| Socialist Labor | Theos A. Grove | 691 | 0.03 | |
| Majority | 113,364 | 5.67 | ||
| Turnout | 2,000,342 | |||
| Republican hold | ||||
Minnesota
[edit]
| |||||||||||||||||||||
| |||||||||||||||||||||
 County results Shipstead: 30–40% 40–50% 50–60% 60–70% 70–80% Benson: 40–50% | |||||||||||||||||||||
| |||||||||||||||||||||
| Party | Candidate | Votes | % | |
|---|---|---|---|---|
| Republican | Henrik Shipstead (Incumbent) | 641,049 | 53.00 | |
| Farmer–Labor | Elmer Austin Benson | 310,875 | 25.70 | |
| Democratic | John E. Regan | 248,658 | 20.56 | |
| Trotskyist Anti-War | Grace Holmes Carlson | 8,761 | 0.72 | |
| Independent | Carl Winter | 256 | 0.02 | |
| Majority | 330,174 | 27.30 | ||
| Turnout | 1,209,599 | |||
| Republican gain from Farmer–Labor | ||||
Mississippi
[edit]
| |||||||||||||||||
| |||||||||||||||||
 County results Bilbo: 50-60% 60-70% 70-80% 80-90% White: 50-60% 60-70% 70-80% Tie: 50% | |||||||||||||||||
| |||||||||||||||||
| Party | Candidate | Votes | % | |
|---|---|---|---|---|
| Democratic | Theodore G. Bilbo (Incumbent) | 143,431 | 100.00 | |
| Democratic hold | ||||
Missouri
[edit]
| |||||||||||||||||
| |||||||||||||||||
 County results Truman: 50–60% 60–70% 70–80% 80–90% Davis: 50–60% 60–70% 70–80% 80–90% | |||||||||||||||||
| |||||||||||||||||
One-term Democrat Harry S. Truman was narrowly re-elected. He would only serve until resigning January 17, 1945, to become U.S. Vice President.
| Party | Candidate | Votes | % | |
|---|---|---|---|---|
| Democratic | Harry S. Truman (Incumbent) | 930,775 | 51.17 | |
| Republican | Manvel H. Davis | 886,376 | 48.73 | |
| Socialist | W.F. Rinck | 1,669 | 0.09 | |
| Socialist Labor | Theodore Baeff | 196 | 0.01 | |
| Majority | 44,499 | 2.44 | ||
| Turnout | 1,819,016 | |||
| Democratic hold | ||||
Montana
[edit]
| |||||||||||||||||
| |||||||||||||||||
 County results Wheeler: 50–60% 60–70% 70–80% 80–90% 90–100% | |||||||||||||||||
| |||||||||||||||||
| Party | Candidate | Votes | % | ±% | |
|---|---|---|---|---|---|
| Democratic | Burton K. Wheeler (Incumbent) | 176,753 | 73.43 | +3.29% | |
| Republican | E. K. Cheadle | 63,941 | 26.57 | −2.17% | |
| Majority | 112,812 | 46.87 | +5.47% | ||
| Turnout | 240,694 | ||||
| Democratic hold | Swing | ||||
Nebraska
[edit]
| |||||||||||||||||
| |||||||||||||||||
 County results Butler: 40–50% 50–60% 60–70% 70–80% Cochran: 40–50% 50–60% | |||||||||||||||||
| |||||||||||||||||
| Party | Candidate | Votes | % | |
|---|---|---|---|---|
| Republican | Hugh A. Butler | 340,250 | 57.00 | |
| Democratic | Robert Leroy Cochran | 247,659 | 41.49 | |
| None | Albert F. Ruthven | 8,982 | 1.50 | |
| Majority | 92,591 | 15.51 | ||
| Turnout | 596,891 | |||
| Republican gain from Democratic | ||||
Nevada
[edit]
| |||||||||||||||||
| |||||||||||||||||
 County results Pittman: 50–60% 60–70% 70–80% 80–90% Platt: 50–60% | |||||||||||||||||
| |||||||||||||||||
Pittman suffered a severe heart attack just before the election on November 5, and two doctors told his aides before the election that death was imminent. To avoid affecting the election, the party told the press that the senator was hospitalized for exhaustion and that his condition was not serious.[5] Pittman died on November 10 at the Washoe General Hospital in Reno, Nevada.[6] Governor Edward Carville would go on to appoint Berkeley L. Bunker as his replacement.
In later years, a myth spread that Pittman had in fact died before the election, and his body had been kept on ice in the Mizpah Hotel in Tonopah so that Carville could appoint his replacement.[5]
| Party | Candidate | Votes | % | |
|---|---|---|---|---|
| Democratic | Key Pittman (Incumbent) | 31,351 | 60.48 | |
| Republican | Samuel Platt | 20,488 | 39.52 | |
| Majority | 10,863 | 20.96 | ||
| Turnout | 51,839 | |||
| Democratic hold | ||||
New Jersey
[edit]
| |||||||||||||||||
| |||||||||||||||||
 County results Barbour: 50–60% 60–70% Cromwell: 50–60% | |||||||||||||||||
| |||||||||||||||||
| Party | Candidate | Votes | % | |
|---|---|---|---|---|
| Republican | W. Warren Barbour (Incumbent) | 1,029,331 | 55.11 | |
| Democratic | James H. R. Cromwell | 823,893 | 44.11 | |
| Socialist | McAlister Coleman | 8,836 | 0.47 | |
| Independent | James A. Tumulty Jr. | 2,784 | 0.15 | |
| Communist | Mary Ellen Dooner | 1,519 | 0.08 | |
| Prohibition | Edson R. Leach | 645 | 0.03 | |
| Socialist Labor | Harry Santhouse | 464 | 0.02 | |
| Socialist Workers | George Breitman | 303 | 0.02 | |
| Majority | 225,438 | 11.00 | ||
| Turnout | 1,867,775 | |||
| Republican hold | ||||
New Mexico
[edit]
| |||||||||||||||||
| |||||||||||||||||
 County results Chevez: 50–60% 60–70% 70–80% Mitchell: 50–60% | |||||||||||||||||
| |||||||||||||||||
| Party | Candidate | Votes | % | |
|---|---|---|---|---|
| Democratic | Dennis Chávez (Incumbent) | 103,194 | 55.95 | |
| Republican | Albert K. Mitchell | 81,257 | 44.05 | |
| Majority | 21,937 | 11.90 | ||
| Turnout | 184,451 | |||
| Democratic hold | ||||
New York
[edit]
| ||||||||||||||||||||
| ||||||||||||||||||||
 County results Mead: 50–60% 60–70% Barton: 50–60% 60–70% 70–80% | ||||||||||||||||||||
| ||||||||||||||||||||
The whole ticket nominated by Democrats and American Laborites was elected.
| Party | Candidate | Votes | % | |
|---|---|---|---|---|
| Democratic | James M. Mead | 2,893,407 | 47.06 | |
| American Labor | James M. Mead | 381,359 | 6.20 | |
| Total | James M. Mead (Incumbent) | 3,274,766 | 53.26 | |
| Republican | Bruce Barton | 2,842,942 | 46.66 | |
| Prohibition | Stephen W. Paine | 4,944 | 0.08 | |
| Total votes | 6,148,562 | 100.00 | ||
| Democratic hold | ||||
North Dakota
[edit]
| |||||||||||||||||||||
 County results Langer: 30–40% 40–50% 50–60% 60–70% Lemke: 30–40% 40–50% 50-–% Vogel: 30–40% 40–50% | |||||||||||||||||||||
| |||||||||||||||||||||
| Party | Candidate | Votes | % | ±% | |
|---|---|---|---|---|---|
| Republican | William Langer | 100,647 | 38.11% | −20.13% | |
| Independent | William Lemke | 92,593 | 35.06% | — | |
| Democratic | Charles J. Vogel | 69,847 | 26.45% | −13.80% | |
| Independent | Jasper Haaland | 1,1014 | 0.38% | — | |
| Majority | 8,054 | 3.05% | −14.95% | ||
| Turnout | 259,607 | ||||
| Republican hold | |||||
Ohio
[edit]
| |||||||||||||||||
| |||||||||||||||||
| |||||||||||||||||
| Party | Candidate | Votes | % | |
|---|---|---|---|---|
| Republican | Harold H. Burton | 1,602,498 | 52.37 | |
| Democratic | John McSweeney | 1,457,304 | 47.63 | |
| Majority | 145,194 | 4.74 | ||
| Turnout | 3,059,802 | |||
| Republican gain from Democratic | ||||
Pennsylvania
[edit]
| |||||||||||||||||
| |||||||||||||||||
 County results
Guffey: 50–60% 60–70% Cooke: 40–50% 50–60% 60–70% 70–80% | |||||||||||||||||
| |||||||||||||||||
| Party | Candidate | Votes | % | ±% | |
|---|---|---|---|---|---|
| Democratic | Joseph F. Guffey (Incumbent) | 2,069,980 | 51.79 | +1.01% | |
| Republican | Jay Cooke | 1,893,104 | 47.36 | −0.90% | |
| Socialist | David H.H. Felix | 15,449 | 0.39 | 0.00% | |
| Prohibition | H. B. Mansell | 11,113 | 0.28 | −0.40% | |
| Communist | Carl Reeve | 4,761 | 0.12 | −0.09% | |
| Socialist Labor | Frank Knotek | 2,503 | 0.06 | −0.10% | |
| N/A | Other | 110 | 0.00 | N/A | |
| Majority | 176,876 | 4.43 | |||
| Turnout | 3,997,020 | ||||
| Democratic hold | Swing | ||||
Rhode Island
[edit]
| Party | Candidate | Votes | % | |
|---|---|---|---|---|
| Democratic | Peter G. Gerry (Incumbent) | 173,927 | 55.16 | |
| Republican | James O. McManus | 141,401 | 44.84 | |
| Majority | 32,526 | 10.32 | ||
| Turnout | 315,328 | |||
| Democratic hold | ||||
Tennessee
[edit]
| |||||||||||||||||
| |||||||||||||||||
 County results McKellar: 50–60% 60–70% 70–80% 80–90% >90% Baker: 50–60% 60–70% 70–80% 80–90% | |||||||||||||||||
| |||||||||||||||||
| Party | Candidate | Votes | % | |
|---|---|---|---|---|
| Democratic | Kenneth McKellar (Incumbent) | 295,440 | 70.80 | |
| Republican | Howard Baker Sr. | 121,790 | 29.19 | |
| Independent | John Randolph Neal Jr. | 35.06 | 0.01 | |
| Majority | 173,650 | 41.61 | ||
| Turnout | 417,265 | |||
| Democratic hold | ||||
Texas
[edit]
| |||||||||||||||||
| |||||||||||||||||
 | |||||||||||||||||
| Party | Candidate | Votes | % | |
|---|---|---|---|---|
| Democratic | Tom Connally (Incumbent) | 978,095 | 94.24 | |
| Republican | George I. Shannon | 59,340 | 5.72 | |
| Communist | Homer Brooks | 408 | 0.04 | |
| Majority | 918,755 | 88.52 | ||
| Turnout | 1,037,843 | |||
| Democratic hold | ||||
Utah
[edit]
| |||||||||||||||||
| |||||||||||||||||
 County results Murdock: 50–60% 60–70% 70–80% Farnsworth: 50–60% 60–70% | |||||||||||||||||
| |||||||||||||||||
| Party | Candidate | Votes | % | |
|---|---|---|---|---|
| Democratic | Abe Murdock | 155,499 | 62.85 | |
| Republican | Philo Farnsworth | 91,931 | 37.15 | |
| Majority | 63,568 | 25.70 | ||
| Turnout | 247,430 | |||
| Democratic hold | ||||
Vermont
[edit]There were 2 elections due to the June 20, 1940, death of two-term Republican Ernest Willard Gibson.
Vermont (regular)
[edit]
| |||||||||||||||||
| |||||||||||||||||
Austin: 50-60% 60-70% 70-80% 80-90% 90-100% Searles: 50-60% 60-70% 80-90% | |||||||||||||||||
| |||||||||||||||||
Two-term Republican Warren Austin was easily re-elected. He faced no opponents in the primary.[8]
| Party | Candidate | Votes | % | |
|---|---|---|---|---|
| Republican | Warren Austin (Incumbent) | 93,283 | 66.4 | |
| Democratic | Ona S. Searles | 47,101 | 33.6 | |
| Total votes | 140,384 | 100.0 | ||
| Majority | 46,182 | 32.9 | ||
| Total votes | 140,388 | |||
| Republican hold | ||||
Austin served only until his August 2, 1946, resignation to become U.S. Ambassador to the United Nations.
Vermont (special)
[edit]
| |||||||||||||||||
| |||||||||||||||||
Aiken: 50-60% 60-70% 70-80% 80-90% 90-100% Comings: 50-60% 60-70% 70-80% 80-90% | |||||||||||||||||
| |||||||||||||||||
Gibson's son, Republican Ernest W. Gibson Jr. was appointed June 24, 1940, to continue his father's term, pending a special election, in which he was not a candidate.
| Party | Candidate | Votes | % | |
|---|---|---|---|---|
| Republican | George Aiken | 87,150 | 61.6 | |
| Democratic | Herbert B. Comings | 54,263 | 38.4 | |
| Majority | 32,887 | 23.20 | ||
| Total votes | 141,413 | |||
| Republican hold | ||||
Aiken did not take the seat until January 10, 1941, as he wanted to remain Governor of Vermont. He would be repeatedly re-elected and serve until his 1975 retirement.
Virginia
[edit]
| |||||||||||||||||
| |||||||||||||||||
 County and Independent City Results Byrd: 80-90% 90-100% | |||||||||||||||||
| |||||||||||||||||
| Party | Candidate | Votes | % | ±% | |
|---|---|---|---|---|---|
| Democratic | Harry F. Byrd Sr. (Incumbent) | 274,260 | 93.32 | +17.36% | |
| Independent | Hilliard Berstein | 11,159 | 3.80 | ||
| Independent | Alice Burke | 8,250 | 2.81 | ||
| Write-ins | 212 | 0.07 | +0.05% | ||
| Majority | 263,101 | 89.53 | +34.50% | ||
| Turnout | 293,881 | ||||
| Democratic hold | |||||
Washington
[edit]
| |||||||||||||||||
| |||||||||||||||||
 County results Wallgren: 50–60% 60–70% Chadwick: 50–60% 60–70% 70–80% | |||||||||||||||||
| |||||||||||||||||
| Party | Candidate | Votes | % | |
|---|---|---|---|---|
| Democratic | Monrad Wallgren | 404,718 | 54.16 | |
| Republican | Stephen F. Chadwick | 342,589 | 45.84 | |
| Majority | 62,129 | 8.32 | ||
| Turnout | 747,307 | |||
| Democratic hold | ||||
West Virginia
[edit]
| |||||||||||||||||
| |||||||||||||||||
 County results Kilgore: 50–60% 60–70% 70–80% Sweeney: 50–60% 60–70% 70–80% | |||||||||||||||||
| |||||||||||||||||
| Party | Candidate | Votes | % | |
|---|---|---|---|---|
| Democratic | Harley M. Kilgore | 492,413 | 56.33 | |
| Republican | Thomas Sweeney | 381,806 | 43.67 | |
| Majority | 110,607 | 12.66 | ||
| Turnout | 874,219 | |||
| Democratic hold | ||||
Wisconsin
[edit]
| |||||||||||||||||||||
| |||||||||||||||||||||
 County results La Follete Jr.: 40–50% 50–60% 60–70% Clausen: 40–50% 50–60% 60–70% | |||||||||||||||||||||
| |||||||||||||||||||||
| Party | Candidate | Votes | % | |
|---|---|---|---|---|
| Progressive | Robert M. La Follette Jr. (Incumbent) | 605,609 | 45.26 | |
| Republican | Fred H. Clausen | 553,692 | 41.38 | |
| Democratic | James E. Finnegan | 176,688 | 13.20 | |
| Independent Communist | Ted Furman | 1,308 | 0.10 | |
| Socialist Labor | Adolf Wiggert Jr. | 838 | 0.06 | |
| Majority | 51,917 | 4.88 | ||
| Turnout | 1,338,135 | |||
| Progressive hold | ||||
Wyoming
[edit]
| |||||||||||||||||
| |||||||||||||||||
 County results O'Mahoney: 50–60% 60–70% 70–80% Simpson: 50–60% | |||||||||||||||||
| |||||||||||||||||
| Party | Candidate | Votes | % | |
|---|---|---|---|---|
| Democratic | Joseph C. O'Mahoney (Incumbent) | 65,022 | 58.74 | |
| Republican | Milward L. Simpson | 45,682 | 41.26 | |
| Majority | 19,340 | 17.48 | ||
| Turnout | 110,704 | |||
| Democratic hold | ||||
See also
[edit]Notes
[edit]References
[edit]- ^ a b c d e f g h i j k l m n o p q r s t u v w x y z aa ab ac ad ae af "Statistics of the Congressional and Presidential election of November 5, 1940" (PDF). Office of the Clerk of the U.S. House. Retrieved November 26, 2014.
- ^ "CONGRESS: New Houses". November 11, 1940. Archived from the original on October 14, 2010. Retrieved December 20, 2017 – via www.time.com.
- ^ a b c d Brandon, Leory D. (1941). Statistics of the Presidential and Congressional Election of November 5 1940. Washington, DC: United States House of Representatives. p. 1.
- ^ "OFFICIAL VOTE OF THE STATE OF ILLINOIS CAST AT THE GENERAL ELECTION, NOV. 5, 1940 JUDICIAL ELECTIONS, 1939-1940 PRIMARY ELECTION GENERAL PRIMARY, APRIL 9, 1940" (PDF). Illinois State Board of Elections. Archived from the original (PDF) on June 24, 2021. Retrieved September 3, 2020.
- ^ a b Nevada Yesterdays. "The Truth Of The Legend Of Key Pittman". KNPR. Las Vegas, NV. Retrieved September 28, 2020.
- ^ Rocha, Guy; Myers, Dennis (May 2003). "Myth #88 - Key Pittman on Ice". Sierra Sage. State Library and Archives, Department of Administration, State of Nevada. Archived from the original on October 4, 2013. Retrieved October 3, 2013.
- ^ Heard, Alexander; Strong, Donald (1950). Southern Primaries and Elections 1920-1949. University of Alabama Press. pp. 177–179. ISBN 9780836955248.
- ^ a b c "VT Elections Database » Search Elections". VT Elections Database. Retrieved July 17, 2020.


