1968 Trentino-Alto Adige/Südtirol regional election
Appearance
(Redirected from Trentino-Alto Adige/Südtirol regional election, 1968)
 |
|---|
|
The Trentino-Alto Adige/Südtirol regional election of 1968 took place on 17 November 1968.
An agreement was signed with the German minority: the two provinces became Autonomous Provinces, with both provincial and regional powers, while the Autonomous Region retained its statal-devolved powers. The SVP so accepted a new alliance with the Christian Democracy. With the activation of the ordinary regions in the rest of Italy, the legislature term rose to five years.
Results
[edit]Regional Council
[edit]
| ||||
|---|---|---|---|---|
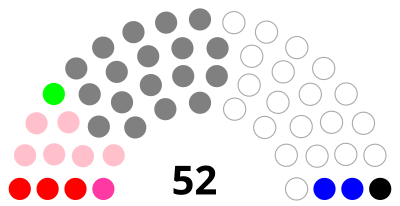
| Party | votes | votes (%) | seats | |
| Christian Democracy | 175,626 | 37.1 | 20 | |
| South Tyrolean People's Party | 137,982 | 29.1 | 16 | |
| Italian Socialist Party–Italian Democratic Socialist Party | 53,810 | 11.4 | 6 | |
| Italian Communist Party–Italian Socialist Party of Proletarian Unity | 37,443 | 7.9 | 4 | |
| Trentino Tyrolean People's Party | 19,922 | 4.2 | 2 | |
| Italian Liberal Party | 17,278 | 3.7 | 2 | |
| Italian Social Movement | 15,108 | 3.2 | 1 | |
| Italian Republican Party | 8,731 | 1.8 | 1 | |
| Social Progressive Party of South Tyrol | 5,332 | 1.1 | - | |
| Craftsman-Farmer Alliance | 2,275 | 0.5 | - | |
| Total | 473,507 | 100.0 | 52 | |
Source: Trentino-Alto Adige/Südtirol Region Archived 2010-05-24 at the Wayback Machine
Trentino
[edit]| Party | votes | votes (%) | seats |
|---|---|---|---|
| Christian Democracy | 142,892 | 58.1 | 16 |
| Italian Socialist Party–Italian Democratic Socialist Party | 37,482 | 15.2 | 4 |
| Trentino Tyrolean People's Party | 18,182 | 7.4 | 2 |
| Italian Communist Party | 16,148 | 5.6 | 2 |
| Italian Liberal Party | 11,406 | 4.6 | 1 |
| Italian Socialist Party of Proletarian Unity | 7,726 | 3.1 | 1 |
| Italian Republican Party | 5,998 | 2.4 | 1 |
| Italian Social Movement | 4,049 | 1.6 | - |
| Craftsman-Farmer Alliance | 2,275 | 0.9 | - |
| Total | 246,158 | 100.0 | 27 |
Source: Trentino-Alto Adige/Südtirol Region Archived 2010-05-24 at the Wayback Machine
South Tyrol
[edit]| Party | votes | votes (%) | seats |
|---|---|---|---|
| South Tyrolean People's Party | 137,982 | 60.7 | 16 |
| Christian Democracy | 32,734 | 14.4 | 4 |
| Italian Socialist Party–Italian Democratic Socialist Party | 16,328 | 7.2 | 2 |
| Italian Communist Party–Italian Socialist Party of Proletarian Unity | 13,569 | 6.0 | 1 |
| Italian Social Movement | 11,059 | 4.9 | 1 |
| Italian Liberal Party | 5,872 | 2.6 | 1 |
| Social Progressive Party of South Tyrol | 5,332 | 2.4 | - |
| Italian Republican Party | 2,733 | 1.2 | - |
| Total | 227,349 | 100.0 | 25 |
Source: Trentino-Alto Adige/Südtirol Region Archived 2010-05-24 at the Wayback Machine
