Linhai
Linhai
临海市 | |
|---|---|
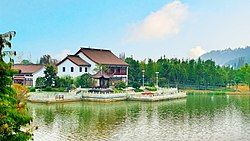
 Linghu Scenic Area, 2019 | |
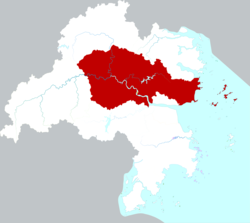
 Location of Linhai City within Taizhou | |
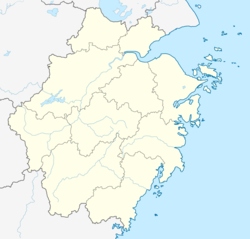
| Coordinates: 28°51′N 121°07′E / 28.850°N 121.117°E | |
| Country | People's Republic of China |
| Province | Zhejiang |
| Prefecture-level city | Taizhou |
| Area | |
| 2,171 km2 (838 sq mi) | |
| • Urban | 2,171 km2 (838 sq mi) |
| • Metro | 2,171 km2 (838 sq mi) |
| Population | |
| 1,114,146 | |
| • Density | 510/km2 (1,300/sq mi) |
| • Urban | 1,114,146 |
| • Urban density | 510/km2 (1,300/sq mi) |
| • Metro | 1,114,146 |
| • Metro density | 510/km2 (1,300/sq mi) |
| Time zone | UTC+8 (China Standard) |
| Website | www |
Linhai (simplified Chinese: 临海; traditional Chinese: 臨海; pinyin: Línhǎi; Tai-chow dialect: Lin-he) is a county-level city in Taizhou, Zhejiang Province situated on the banks of the Lin River in Eastern China.
As of the 2020 census, its population was 1,114,146 inhabitants even though its built-up (or metro) area is much smaller.
Its Cathedral of the Sacred Heart of Jesus is the episcopal see of the Roman Catholic Diocese of Linhai.
History and sights
[edit]
-
Linhai Ancient City Wall, dubbed the "Great Wall of Jiangnan"
Its wall attracts many tourists. Construction of the wall, originally over 6 kilometres (3.7 miles) long, began in the Jin Dynasty (266–420) and was not finished until the Sui (581–618) and Tang (618–907) Dynasties. The northern portion, along a high ridge, and the western & southern portions, along the Lin River, still exist and are in good condition.
Administrative divisions
[edit]Subdistricts:[3]
- Gucheng Subdistrict (古城街道), Dayang Subdistrict (大洋街道), Jiangnan Subdistrict (江南街道), Datian Subdistrict (大田街道), Shaojiadu Subdistrict (邵家渡街道)
Towns:
- Xunqiao (汛桥镇), Dongcheng (东塍镇), Xiaozhi (小芝镇), Taozhu (桃渚镇), Shangpan (上盘镇), Duqiao (杜桥镇), Yongquan (涌泉镇), Youxi (尤溪镇), Hetou (河头镇), Yanjiang (沿江镇), Kuocang (括苍镇), Yongfeng (永丰镇), Huixi (汇溪镇), Baishuiyang (白水洋镇)
Climate
[edit]| Climate data for Linhai (1991–2020 normals, extremes 1981–2010) | |||||||||||||
|---|---|---|---|---|---|---|---|---|---|---|---|---|---|
| Month | Jan | Feb | Mar | Apr | May | Jun | Jul | Aug | Sep | Oct | Nov | Dec | Year |
| Record high °C (°F) | 24.4 (75.9) |
29.9 (85.8) |
31.2 (88.2) |
35.8 (96.4) |
37.0 (98.6) |
39.0 (102.2) |
41.3 (106.3) |
39.8 (103.6) |
38.4 (101.1) |
35.1 (95.2) |
30.7 (87.3) |
26.0 (78.8) |
41.3 (106.3) |
| Mean daily maximum °C (°F) | 11.6 (52.9) |
13.7 (56.7) |
17.2 (63.0) |
22.9 (73.2) |
27.0 (80.6) |
29.6 (85.3) |
34.1 (93.4) |
33.4 (92.1) |
29.6 (85.3) |
25.2 (77.4) |
19.8 (67.6) |
14.1 (57.4) |
23.2 (73.7) |
| Daily mean °C (°F) | 6.9 (44.4) |
8.5 (47.3) |
11.9 (53.4) |
17.1 (62.8) |
21.8 (71.2) |
25.1 (77.2) |
28.9 (84.0) |
28.4 (83.1) |
25.0 (77.0) |
20.1 (68.2) |
14.8 (58.6) |
9.0 (48.2) |
18.1 (64.6) |
| Mean daily minimum °C (°F) | 3.5 (38.3) |
4.9 (40.8) |
8.1 (46.6) |
12.9 (55.2) |
18.0 (64.4) |
22.0 (71.6) |
25.1 (77.2) |
25.0 (77.0) |
21.7 (71.1) |
16.3 (61.3) |
11.2 (52.2) |
5.3 (41.5) |
14.5 (58.1) |
| Record low °C (°F) | −6.4 (20.5) |
−5.2 (22.6) |
−4.9 (23.2) |
0.1 (32.2) |
7.7 (45.9) |
12.4 (54.3) |
17.7 (63.9) |
17.8 (64.0) |
12.3 (54.1) |
1.9 (35.4) |
−1.3 (29.7) |
−6.0 (21.2) |
−6.4 (20.5) |
| Average precipitation mm (inches) | 65.8 (2.59) |
59.9 (2.36) |
127.2 (5.01) |
111.8 (4.40) |
145.0 (5.71) |
245.5 (9.67) |
200.0 (7.87) |
326.4 (12.85) |
183.6 (7.23) |
80.9 (3.19) |
69.2 (2.72) |
55.4 (2.18) |
1,670.7 (65.78) |
| Average precipitation days (≥ 0.1 mm) | 11.8 | 12.4 | 16.6 | 15.2 | 16.1 | 18.8 | 14.3 | 16.7 | 13.0 | 7.7 | 10.0 | 9.4 | 162 |
| Average snowy days | 1.9 | 1.3 | 0.4 | 0 | 0 | 0 | 0 | 0 | 0 | 0 | 0 | 0.7 | 4.3 |
| Average relative humidity (%) | 73 | 74 | 75 | 75 | 77 | 82 | 78 | 79 | 78 | 74 | 75 | 72 | 76 |
| Mean monthly sunshine hours | 104.8 | 102.8 | 120.7 | 139.8 | 139.0 | 111.3 | 210.3 | 199.2 | 157.4 | 163.3 | 119.1 | 122.5 | 1,690.2 |
| Percent possible sunshine | 32 | 32 | 32 | 36 | 33 | 27 | 49 | 49 | 43 | 46 | 37 | 38 | 38 |
| Source: China Meteorological Administration[4][5] | |||||||||||||
References
[edit]- ^ "China: Zhèjiāng (Prefectures, Cities, Districts and Counties) - Population Statistics, Charts and Map".
- ^ "China: Zhèjiāng (Prefectures, Cities, Districts and Counties) - Population Statistics, Charts and Map". www.citypopulation.de. Retrieved 21 April 2018.
- ^ "台州市-行政区划网 www.xzqh.org" (in Chinese). XZQH. Retrieved 2012-05-24.
- ^ 中国气象数据网 – WeatherBk Data (in Simplified Chinese). China Meteorological Administration. Retrieved 25 June 2023.
- ^ 中国气象数据网 (in Simplified Chinese). China Meteorological Administration. Retrieved 25 June 2023.
Sources and external links
[edit]


