p <- read.csv("demandweighteddailyaverageprice2012.csv", skip = 0,header=TRUE, sep=",", na.strings="na", dec=".", strip.white=TRUE)
#examine data
str(p)
'data.frame':	1152 obs. of  2 variables:
 $ Date : Factor w/ 1152 levels "10/01/2010","10/01/2011",..: 501 545 583 621 659 697 735 773 809 844 ...
 $ Price: num  46.5 43.5 45.5 46.5 53.8 ...
# 5 number summary of price
summary(p$Price)
     Min.   1st Qu.    Median      Mean   3rd Qu.      Max.
   0.6819   38.0900   62.0500   71.7400   91.6000 2911.0000
# convert p$Price into time series
pts<-ts(p$Price, frequency = 365, start = c(2009, 201))
# examine time series object
str(pts)
Time-Series [1:1152] from 2010 to 2013: 46.5 43.5 45.5 46.5 53.8 ...
# load SVG device
library("RSVGTipsDevice")
# define name and size of SVG graphic to be created by SVG device
devSVGTips(file="ws-el-price-2009-2012red.svg",toolTipMode=0,width=8,height=6)
# plot commands
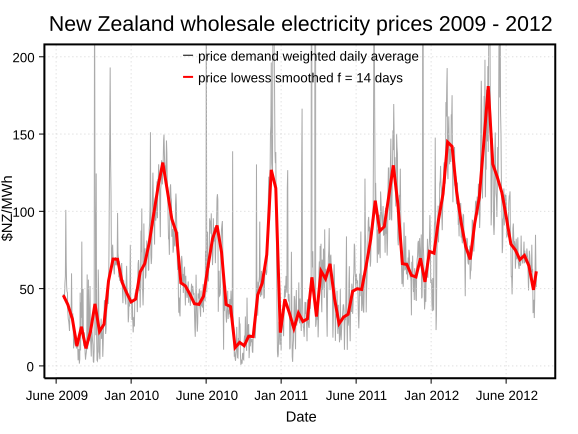
plot(pts,ylim=c(0,200),axes="FALSE",type="l",col="darkgrey",cex.main=1.6, main="New Zealand wholesale electricity prices 2009 - 2012",las=1,xlab="Date",ylab="$NZ/MWh")
axis(side=1, las=1,line =0 ,at=c(2009.5,2010.0,2010.5,2011.0,2011.5,2012.0,2012.5),  labels=c("June 2009","Jan 2010","June 2010","Jan 2011","June 2011","Jan 2012","June 2012"))
axis(side=2, las=2)
grid()
lines(lowess(pts,f = 14/1152),type="l",col=2,lty=1,lwd=3)
legend("top",bty='n',bg="white", c("price demand weighted daily average","", "price lowess smoothed f = 14 days"), lty = c(1,NA,1),lwd=c(1,NA,2), pch=c(NA,NA,NA),col = c(1,NA,2))
box(lwd=2)
# turn off plotting device (SVG)
dev.off()


