File:WSPR 2014.svg
Page contents not supported in other languages.
Tools
Actions
General
In other projects
Appearance

Size of this PNG preview of this SVG file: 540 × 450 pixels. Other resolutions: 288 × 240 pixels | 576 × 480 pixels | 922 × 768 pixels | 1,229 × 1,024 pixels | 2,458 × 2,048 pixels.
Original file (SVG file, nominally 540 × 450 pixels, file size: 136 KB)
| This is a file from the Wikimedia Commons. Information from its description page there is shown below. Commons is a freely licensed media file repository. You can help. |
Summary
| DescriptionWSPR 2014.svg |
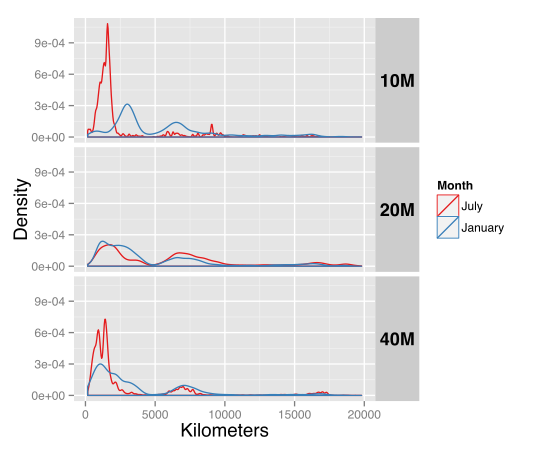
English: Density distribution of WSPR spots, January 2014 vs July 2014, using only most distant reception per spot. |
| Date | |
| Source | Own work |
| Author | Kaizen Dave |
R code to produce chart
rm(list=ls())
gc(verbose=TRUE, reset=TRUE)

library(stringi)
library(plyr)
library(dplyr)
library(ggplot2)

# Function to get spots for a given month.  Downloads zip file from WSPR web site and saves it as local
# RData if necessary, otherwise reads local RData file.  Performs minor cleanup on downloaded file.

GetSpots <- function(year, month) {

    if ( ! dir.exists("./spots") ) {
        dir.create("./spots")
    }
    month <- sprintf("%02d", month)
    rdata <- stri_join("./spots/wsprspots-", year, "-", month, ".RData")
    if ( file.exists(rdata) ) {
        message(stri_join("Loading: ", rdata))
        load(rdata)
    } else {
        url <- stri_join("http://wsprnet.org/archive/wsprspots-", year, "-", month, ".csv.zip")
        zip <- stri_join("./spots/wsprspots-", year, "-", month, ".csv.zip")
        csv <- stri_join("./spots/wsprspots-", year, "-", month, ".csv")
        if ( ! file.exists(csv) ) {
            message(message(stri_join("Downloading: ", zip)))
            download.file(url, zip, method = "curl")
            unzip(zip, exdir = "./spots")
            file.remove(zip)
        }
        message(stri_join("Reading: ", csv))
        spots <- read.csv(csv,
                          header = FALSE,
                          stringsAsFactors = FALSE,
                          col.names = c("id", "ts", "dst.call", "dst.grid", "snr", "freq", "src.call",
                                        "src.grid", "pwr", "drift", "km", "az", "band", "ver", "code"),
                          colClasses = c("integer", "integer", "character", "character", "integer", "numeric",
                                         "character", "character", "integer", "integer", "integer", "integer",
                                         "integer", "character", "integer"))
        # Generate POSIXlt from decimal.
        spots$ts <- as.POSIXlt(spots$ts, origin = "1970-01-01", tz = "GMT")
        # UCASE call signs and grids.
        spots$src.call <- toupper(spots$src.call)
        spots$src.grid <- toupper(spots$src.grid)
        spots$dst.call <- toupper(spots$dst.call)
        spots$dst.grid <- toupper(spots$dst.grid)
        # Dump zero-distance spots.
        spots <- spots[spots$km > 0,]
        # Save as RData for future quick load.
        save(spots, file = rdata)
        file.remove(csv)
    }
    spots
}

bandname <- list()
bandname[[28]] <- "10M"
bandname[[14]] <- "20M"
bandname[[7]]  <- "40M"
rdata <- "./spotinfo.RData"
if ( file.exists(rdata) ) {
    message(stri_join("Loading: ", rdata))
    load(rdata)
} else {
    spotinfo <- NULL
    year <- 2014
    for ( month in c(7, 1) ) {
        spots <- GetSpots(year, month)
        for ( band in c(28, 14, 7) ) {
            # Trim to band of interest and remove ground wave (~100 miles/160km) spots.
            tmp <- spots[spots$band == band & spots$km > 160, c("ts", "src.call", "km")]
            # We will soon rely on the fact that all spots are transmitted on the top of the
            # minute - i.e. at YYYY-MM-MM HH:MM:00. (Note 00 seconds.)  Verify.
            stopifnot(0 == sum(spots$ts$sec != 0))
            # Convert timestamp to character as dplyr can't sort on POSIXlt.
            tmp$tsc <- as.character(tmp$ts)
            tmp$ts <- NULL
            # Group by src.call and timestamp.  I.e. group all receptions of a single transmission.
            g <- group_by(tmp, src.call, tsc)
            # Keep only the most distant reception for each transmission.
            s <- summarise(g, km.max = max(km, na.rm = TRUE))
            # Build data frame such that we can use ggplot2 facets.
            spotinfo <- rbind(spotinfo, data.frame(Month = month.name[month],
                                                   Band = bandname[[band]],
                                                   vals = s$km.max))
        }
    }
    save(spotinfo, file = rdata)
}

g <- ggplot(spotinfo, aes(x = vals)) +
    geom_density(data = spotinfo,
                 alpha = 0.3,
                 aes(x = vals, group = Month, colour = Month)) +
    facet_grid(Band ~ .) +
    scale_color_brewer(palette="Set1") +
    # Title not required, use caption in Wikipedia to describe.
    # ggtitle("Density Distribution of WSPR Spots\nJanuary 2014 vs July 2014\n(using only most distant reception per spot)") +
    xlab("Kilometers") +
    ylab("Density") +
    theme(axis.title.x = element_text(size = rel(1.25))) +
    theme(axis.title.y = element_text(size = rel(1.25))) +
    theme(strip.text.y = element_text(angle = 0, face = "bold", size = rel(1.5)))
g

svg("./WSPR 2014.svg", width = 6, height = 5)
g
dev.off()
Licensing
I, the copyright holder of this work, hereby publish it under the following license:
This file is licensed under the Creative Commons Attribution-Share Alike 4.0 International license.
- You are free:
- to share – to copy, distribute and transmit the work
- to remix – to adapt the work
- Under the following conditions:
- attribution – You must give appropriate credit, provide a link to the license, and indicate if changes were made. You may do so in any reasonable manner, but not in any way that suggests the licensor endorses you or your use.
- share alike – If you remix, transform, or build upon the material, you must distribute your contributions under the same or compatible license as the original.
Captions
Add a one-line explanation of what this file represents
Items portrayed in this file
depicts
some value
6 November 2015
File history
Click on a date/time to view the file as it appeared at that time.
| Date/Time | Thumbnail | Dimensions | User | Comment | |
|---|---|---|---|---|---|
| current | 23:21, 6 November 2015 |  | 540 × 450 (136 KB) | Kaizen Dave | Removed cryptic title from graphic as there is ample room to describe graphic in Wikipedia caption. |
| 19:17, 6 November 2015 |  | 540 × 450 (163 KB) | Kaizen Dave | User created page with UploadWizard |
File usage
The following page uses this file:
Global file usage
The following other wikis use this file:
- Usage on es.wikipedia.org
- Usage on it.wikipedia.org
Metadata
This file contains additional information, probably added from the digital camera or scanner used to create or digitize it.
If the file has been modified from its original state, some details may not fully reflect the modified file.
| Width | 432pt |
|---|---|
| Height | 360pt |
Retrieved from "https://en.wikipedia.org/wiki/File:WSPR_2014.svg"
