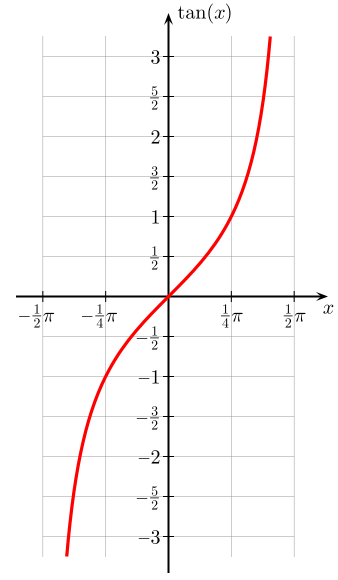
File:Tangent one period.svg
Appearance

Size of this PNG preview of this SVG file: 338 × 580 pixels. Other resolutions: 140 × 240 pixels | 280 × 480 pixels | 447 × 768 pixels | 597 × 1,024 pixels | 1,193 × 2,048 pixels.
Original file (SVG file, nominally 338 × 580 pixels, file size: 17 KB)
File history
Click on a date/time to view the file as it appeared at that time.
| Date/Time | Thumbnail | Dimensions | User | Comment | |
|---|---|---|---|---|---|
| current | 14:24, 21 February 2010 |  | 338 × 580 (17 KB) | Geek3 | author: geek3 |
File usage
The following page uses this file:
Global file usage
The following other wikis use this file:
- Usage on cs.wikipedia.org
- Usage on de.wikipedia.org
- Usage on gl.wikipedia.org
- Usage on hy.wikipedia.org
- Usage on mk.wikipedia.org
- Usage on pl.wikipedia.org
- Usage on pt.wikipedia.org

