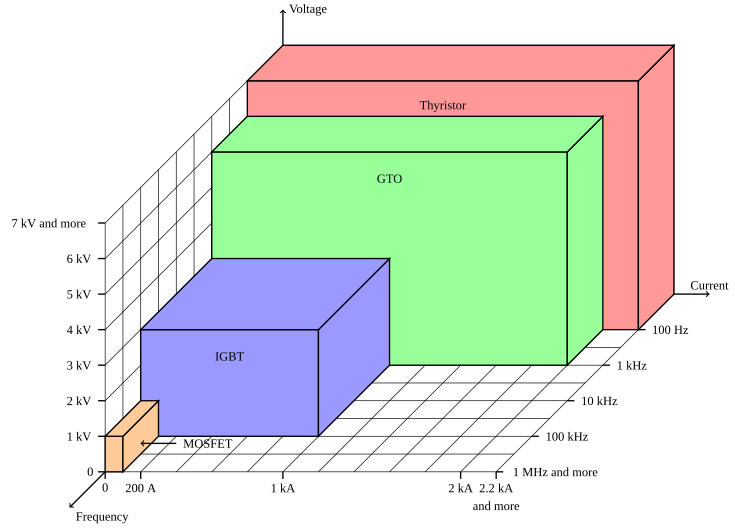
This figure represents aproximately the domain covered by the main power electronics switches in the (U,I,f) space. Please note that the values are very inacurate, (improvement of technologies, specific requirements of applications...). The limits are not absolute, as it is for example possible to connect devices in parallel to increase their current ratings. Only Silicon devices have been considered.
Also please note that the domains are represented by rectangles, but it might not be possible to achieve the max U,I,f at the same time.
If you think I should change the data, please let me know: cyril DOT buttay AT free DOT fr
The figure has been generated using LaTeX (and the tex4ht driver) and the pgf package (version 1.01). The code is as follow (public domain):
% this document generates a graph that represents the
% application domain of the main power electronics switches
% this file is intended to be compiled with latex/tex4ht

\documentclass[a4paper]{article}
\usepackage[english]{babel}
\usepackage[latin1]{inputenc}

\usepackage{tikz}
\def\pgfsysdriver{pgfsys-tex4ht.def}
\usepackage{tex4ht}

\begin{document}
\begin{tikzpicture}[scale=1]
  \begin{scope}[thick]
    % drawing of the axes
    \draw[->] (0,0) -- (12,0) node[anchor=south]{Current};
    \draw[->] (0,0) -- (0,8) node[anchor=west]{Voltage};
    \draw[->] (0,0) -- (-6,-6) node[anchor=north west]{Frequency};

    % the scales
    \foreach \x/\xtext in {-5/0 , -4/1~kV , -3/2~kV , -2/3~kV , -1/4~kV ,
      0/5~kV , 1/6~kV , 2/{7~kV~and~more}}{
      \draw (-5.2,\x) node[anchor=east]{\xtext};
      \draw(-5,\x) -- +(-0.2,0);
    }
    \foreach \x/\xtext in {-5/0 , -4/200~A , 0/1~kA , 5/2~kA , 6/{2.2~kA}}{
      \draw (\x,-5.2) node[anchor=north]{\xtext};
      \draw (\x,-5) -- +(0,-0.2);
    }

    \foreach \position/\xtext in {{(10,-1)}/{100~Hz},{(9,-2)}/{1~kHz},
      {(8,-3)}/{10~kHz},{(7,-4)}/{100~kHz},{(6,-5)}/{1~MHz and more}}{
      \draw\position -- ++(0.2,0) node[anchor=west]{\xtext};
    }
    \draw (6,-5.7) node[anchor=north]{and more};
  \end{scope}

  % now the grid
  \begin{scope}[thin]
    \foreach \x in {1,...,7}{
      \draw (0,\x) -- +(-5,-5);
      \draw (0,\x) -- +(11,0);
    }
    \foreach \x in {1,...,11}{
      \draw (\x,0) -- +(-5,-5);
      \draw (\x,0) -- +(0,7);
    }
    \foreach \x in {-5,-4.5,...,0}{
      \draw (\x,\x) -- +(0,7);
      \draw (\x,\x) -- +(11,0);
    }
  \end{scope}

  % and now add the data
  \begin{scope}[thick, draw=black]
    % first rectangle, the thyristor
    \filldraw [fill=red!40] (-1,-1)--++(0,7) node(THY1){}--++(11,0)--++(0,-7) node(THY2){}--cycle;
    \filldraw [fill=red!40] (THY2.base)--++(1,1)--++(0,7)--++(-1,-1)--cycle;
    \filldraw [fill=red!40] (THY1.base)--++(1,1)--++(11,0)--++(-1,-1)--cycle;
    \draw (4.5,5) node[anchor=south]{Thyristor};
    % second rectangle, the GTO
    \filldraw [fill=green!40] (-2,-2)--++(0,6) node(GTO1){} --++(10,0)--++(0,-6) node(GTO2){}--cycle;
    \filldraw [fill=green!40] (GTO2.base)--++(1,1)--++(0,6)--++(-1,-1)--cycle;
    \filldraw [fill=green!40] (GTO1.base)--++(1,1)--++(10,0)--++(-1,-1)--cycle;
    \draw (3,3) node[anchor=south]{GTO};
    % and now... the IGBT
    \filldraw [fill=blue!40] (-4,-4)--++(0,3) node(IGB1){} --++(5,0)--++(0,-3) node(IGB2){}--cycle;
    \filldraw [fill=blue!40] (IGB2.base)--++(2,2)--++(0,3)--++(-2,-2)--cycle;
    \filldraw [fill=blue!40] (IGB1.base)--++(2,2)--++(5,0)--++(-2,-2)--cycle;
    \draw (-1.5,-2) node[anchor=south]{IGBT};
    % the MOSFET
    \filldraw [fill=orange!40] (-5,-5)--++(0,1) node(MOS1){} --++(0.5,0)--++(0,-1) node(MOS2){}--cycle;
    \filldraw [fill=orange!40] (MOS2.base)--++(1,1)--++(0,1)--++(-1,-1)--cycle;
    \filldraw [fill=orange!40] (MOS1.base)--++(1,1)--++(0.5,0)--++(-1,-1)--cycle;
    \draw [->](-3,-4.2) node[anchor=west]{MOSFET} -- (-4,-4.2);
  \end{scope}
\end{tikzpicture}
\end{document}


