| Source |
Own work.
Sources
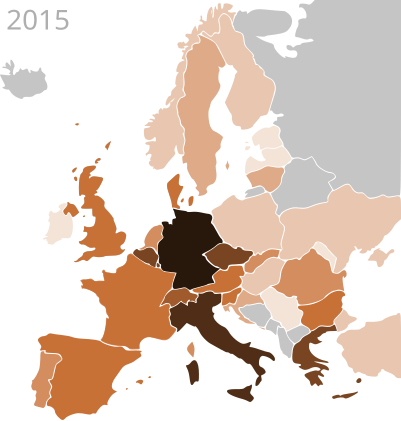
Color changes in map for 2015 (watt-per-capita 2014→2015).
- Austria 90 → 120
- Croatia 8 → 12
- France 85 → 105
- Netherlands 67 → 95 (unchanged)
- Poland 0.7 → 1.x
- Portugal 37 → 55
- Slovakia 98.5 → 99.5 (unchanged)
- Slovenia 126 → 135 (unchanged)
- Sweden 8.2 → 15
- Switzerland 133 → 160
- Turkey 0.8 → 3
- United Kingdom 79.6 → 125
- Check: n/a, <0.1 for Macedonia, Albania, Monte Negro, Bosnia-Herzegovina, Iceland, Belarus and Russia
Color-scale and #HEXcode
- ▇ (<0.1) →
#C5C5C5
- ▇ (0.1–1 ) →
#F4E3D7
- ▇ (1–10 ) →
#E9C6AF
- ▇ (10–50) →
#DEAA87
- ▇ (50–100) →
#D38D5F
- ▇ (100–150) →
#C87137
- ▇ (150–200) →
#A05A2C
- ▇ (200–300) →
#784421
- ▇ (300–450) →
#502D16
- ▇ (450–600) →
#28170B
| Data table — Watts Per Capita Calculation In 2014 |
|---|
| Country |
Capacity
2014 |
Added
2014 |
Popultaion |
Watts per
Capita |
 Austria Austria
| 766
| 140
| 8,477,000 | 90.4 |
 Belgium Belgium
| 3074
| 65
| 11,162,000 | 275.4 |
 Bulgaria Bulgaria
| 1,022
| 2
| 7,261,000 | 140.8 |
 Croatia Croatia
| 34.2
| 14.2
| 4,253,000 | 8.1 |
 Cyprus Cyprus
| 64.8
| 30
| 1,141,000 | 75.5 |
 Czech Republic Czech Republic
| 2,134
| 2
| 10,520,000 | 202.9 |
 Denmark Denmark
| 603
| 39
| 5,612,000 | 107.4 |
 Estonia Estonia
| 0.2
| 0.1
| 1,283,000 | 0.6 |
 Finland Finland
| 10
| 0
| 5,436,000 | 1.9 |
 France France
| 5,660
| 927
| 66,475,000 | 85.1 |
 Germany Germany
| 38,200
| 1,900
| 80,586,000 | 474.0 |
 Greece Greece
| 2,595
| 16
| 11,030,000 | 235.3 |
 Hungary Hungary
| 38.2
| 3.2
| 9,894,000 | 3.9 |
 Ireland Ireland
| 1.1
| 0.1
| 4,595,400 | 0.7 |
 Italy Italy
| 18,460
| 385
| 59,862,000 | 308.4 |
 Latvia Latvia
| 1.5
| 0
| 2,011,000 | 0.8 |
 Lithuania Lithuania
| 68.1
| 0.1
| 2,956,000 | 23.1 |
 Luxembourg Luxembourg
| 110
| 15
| 543,000 | 200.1 |
 Malta Malta
| 54
| 26
| 423,000 | 127.5 |
 Netherlands Netherlands
| 1,123
| 400
| 16,800,000 | 66.8 |
 Norway Norway
| 13
| 2
| 5,090,000 | 2.6 |
 Poland Poland
| 24
| 20
| 38,548,000 | 0.7 |
 Portugal Portugal
| 391
| 110
| 10,609,000 | 36.9 |
 Romania Romania
| 1,219
| 69
| 19,960,000 | 61.1 |
 Serbia Serbia
| ?
| ?
| 7,147,000 | 0.x |
 Slovakia Slovakia
| 533
| 0.4
| 5,413,000 | 98.5 |
 Slovenia Slovenia
| 256
| 7.7
| 2,060,000 | 124.2 |
 Spain Spain
| 5,385
| 22
| 46,610,000 | 115.5 |
 Sweden Sweden
| 79
| 36
| 9,593,000 | 8.2 |
 Switzerland Switzerland
| 1,076
| 320
| 8,075,000 | 133.3 |
 Turkey Turkey
| 58
| 40
| 76,667,000 | 0.8 |
 Ukraine Ukraine
| TBA
| TBA
| 45,461,000 | 1x.6 |
 United Kingdom United Kingdom
| 5,104
| 2,273
| 64,100,000 | 79.6 |
|
Note: figures in parenthesis are still from the previous year (no data avail. yet)
Sources: capacity figures from IEA-PVPS and PV Barometer (URL see section "Summary")
Other European countries:
- To be listed: Albania, Belarus, Bosnia, Iceland, Macedonia, Montenegro, Russia
- Not in map's scope: Armenia, Azerbaijan, Cyprus, Faroe Islands, Georgia, Kazakhstan.
- Not displayed on map: Andorra, Kosovo, Liechtenstein, Malta, Monaco, San Marino, Vatican.
Population figures: List of European countries by population and google service (sources include World Bank, 2013). Figures rounded. Likely to differ from those used in reports and may therefore be inconsistent with displayed W/cap-figures
|
|


