Jump to content

File:Fuel-economy-at-various.svg

Page contents not supported in other languages.
This is a file from the Wikimedia Commons
From Wikipedia, the free encyclopedia

Original file (SVG file, nominally 850 × 400 pixels, file size: 15 KB)

Summary

Description
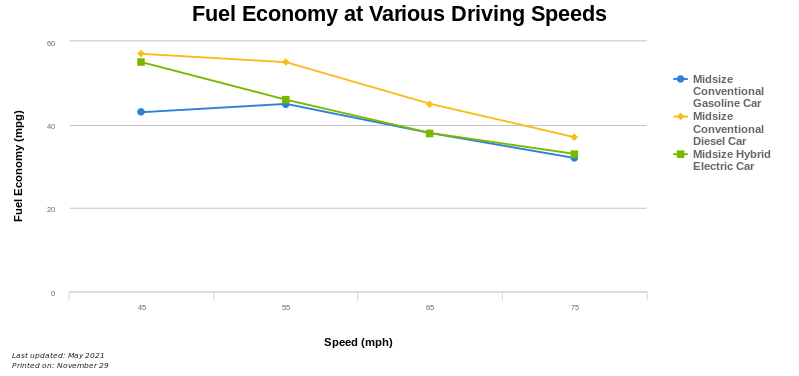
English: This chart shows how fuel economy varies with driving speed for midsize cars of three fuel types, as modeled by Argonne National Laboratory's Autonomie model. Midsize conventional gasoline cars achieve their best fuel economy at 55 mph. The fuel economy of midsize conventional diesel cars declines gradually from 45 to 55 mph and then drops quickly thereafter. The midsize hybrid electric vehicle loses efficiency more evenly between 45 and 75 mph. Source: Oak Ridge National Laboratory, Transportation Energy Data Book #39, Table 4.33.
Date
Source https://afdc.energy.gov/data/10312
Author Unknown authorUnknown author

Licensing

Public domain This image is a work of a United States Department of Energy (or predecessor organization) employee, taken or made as part of that person's official duties. As a work of the U.S. federal government, the image is in the public domain.

Please note that national laboratories operate under varying licences and some are not free. Check the site policies of any national lab before crediting it with this tag.


العربية  English  français  日本語  македонски  മലയാളം  Nederlands  русский  українська  Tiếng Việt  简体中文  繁體中文  +/−

Captions

Fuel economy at various driving speeds

Items portrayed in this file

depicts

1 May 2021

image/svg+xml

File history

Click on a date/time to view the file as it appeared at that time.

Date/TimeThumbnailDimensionsUserComment
current16:25, 29 November 2023Thumbnail for version as of 16:25, 29 November 2023850 × 400 (15 KB)JohnjbartonUploaded a work by from https://afdc.energy.gov/data/10312 with UploadWizard

The following page uses this file:

Metadata