Jump to content

File:Force-distance-diagram.svg

Page contents not supported in other languages.
This is a file from the Wikimedia Commons
From Wikipedia, the free encyclopedia

Original file (SVG file, nominally 899 × 889 pixels, file size: 24 KB)

Summary

Description
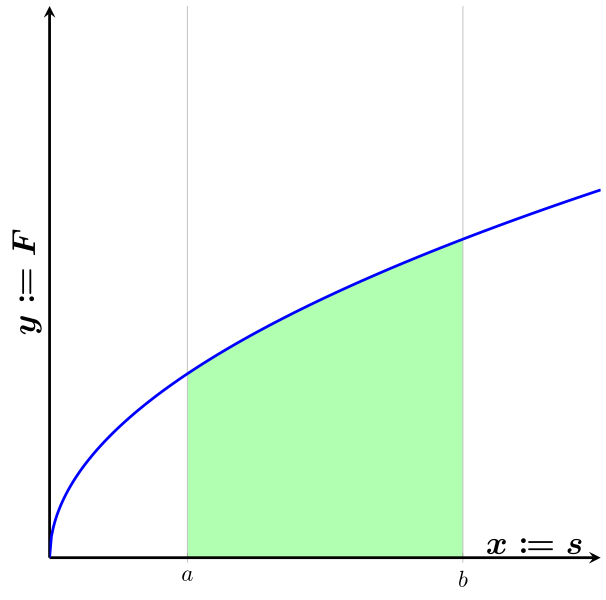
English: Force-distance diagramm. The marked area is work. Force is variable.
Deutsch: Kraft-Weg Diagramm bei veränderbarer Kraft. Die markierte Fläche ist die verrichtete Arbeit.
Date
Source Own work
Author MartinThoma
 
W3C-validity not checked.

Source is available at github

LaTeX Code

\documentclass[varwidth=true, border=2pt]{standalone}

\usepackage{pgfplots}
\pgfplotsset{compat=1.10}
\usepackage{tikz}
\usepgfplotslibrary{fillbetween}
\usepackage{mathtools}

\begin{document}
\begin{tikzpicture}
    \begin{axis}[
        width=10cm,
        height=10cm,
        % Grid
        grid = major,
        % size
        xmin= 0,     % start the diagram at this x-coordinate
        xmax= 4,   % end   the diagram at this x-coordinate
        ymin= 0,     % start the diagram at this y-coordinate
        ymax= 3, % end   the diagram at this y-coordinate
        % Legende
        legend style={
            font=\large\sansmath\sffamily,
            at={(0.5,-0.18)},
            anchor=north,
            legend cell align=left,
            legend columns=-1,
            column sep=0.5cm
        },
        % Ticks
        tick align=inside,
        %minor tick num=3,
        minor tick style={thick},
        scaled y ticks = false,
        xtick={0, 1, 3},
        xticklabels={0, $a$, $b$},
        ytick=\empty,
        axis lines = middle,
        axis line style = very thick,
        xlabel=$x \coloneqq s$,
        x label style={at={(axis description cs:0.88,0.05)},
                       anchor=north,
                       font=\boldmath\Large},
        ylabel=$y \coloneqq F$,
        y label style={at={(axis description cs:0,0.5)},
                       anchor=south,
                       rotate=90,
                       font=\boldmath\Large},
        ]
      \addplot[domain=0:4, blue, very thick, samples=500, name path=f] {sqrt(x)};
      \path[name path=axis] (axis cs:0,0) -- (axis cs:10,0);
      \addplot[fill=green,
               fill opacity=0.3]
       fill between[of=f and axis,soft clip={domain=1:3}];
    \end{axis} 
\end{tikzpicture}
\end{document}

Licensing

I, the copyright holder of this work, hereby publish it under the following license:
Creative Commons CC-Zero This file is made available under the Creative Commons CC0 1.0 Universal Public Domain Dedication.
The person who associated a work with this deed has dedicated the work to the public domain by waiving all of their rights to the work worldwide under copyright law, including all related and neighboring rights, to the extent allowed by law. You can copy, modify, distribute and perform the work, even for commercial purposes, all without asking permission.

Captions

Add a one-line explanation of what this file represents

Items portrayed in this file

depicts

12 August 2014

image/svg+xml

File history

Click on a date/time to view the file as it appeared at that time.

Date/TimeThumbnailDimensionsUserComment
current02:46, 13 August 2014Thumbnail for version as of 02:46, 13 August 2014899 × 889 (24 KB)MartinThoma{{Information |Description ={{en|1=Force-distance diagramm. The marked area is work. Force is variable.}} {{de|1=Kraft-Weg Diagramm bei veränderbarer Kraft. Die markierte Fläche ist die verrichtete Arbeit.}} |Source ={{own}} |Author...

The following page uses this file:

Global file usage

The following other wikis use this file:

Metadata