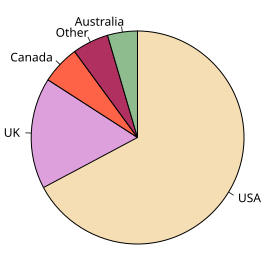
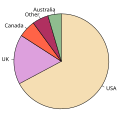
File:English dialects1997.svg
Appearance

Size of this PNG preview of this SVG file: 269 × 260 pixels. Other resolutions: 248 × 240 pixels | 497 × 480 pixels | 795 × 768 pixels | 1,059 × 1,024 pixels | 2,119 × 2,048 pixels.
Original file (SVG file, nominally 269 × 260 pixels, file size: 12 KB)
File history
Click on a date/time to view the file as it appeared at that time.
| Date/Time | Thumbnail | Dimensions | User | Comment | |
|---|---|---|---|---|---|
| current | 18:40, 18 October 2020 |  | 269 × 260 (12 KB) | Tofeiku | File uploaded using svgtranslate tool (https://svgtranslate.toolforge.org/). Added translation for ms. |
| 19:02, 9 July 2007 |  | 269 × 260 (12 KB) | Mwtoews | == Summary == See Image:English dialects1997.png for information regarding the figure. Created in R, using (roughly): <pre> dat <- c(USA=226710, UK=56990, Canada=19700, Australia=15316, Other=18581) col <- c("wheat", "pl |
File usage
The following 4 pages use this file:
Global file usage
The following other wikis use this file:
- Usage on bew.wikipedia.org
- Usage on cs.wikipedia.org
- Usage on en.wikibooks.org
- Usage on en.wikiversity.org
- Usage on es.wikipedia.org
- Usage on hi.wikipedia.org
- Usage on hr.wikipedia.org
- Usage on ja.wikipedia.org
- Usage on ko.wikipedia.org
- Usage on no.wikipedia.org
- Usage on pa.wikipedia.org
- Usage on pl.wikipedia.org
- Usage on pl.wiktionary.org
- Usage on sh.wikipedia.org
- Usage on simple.wikipedia.org
- Usage on sv.wikibooks.org
- Usage on ta.wikipedia.org
- Usage on tr.wikipedia.org
- Usage on uk.wikipedia.org
- Usage on uz.wikipedia.org
- Usage on zh-yue.wikipedia.org
- Usage on zh.wikipedia.org
