File:Dissonance-a220-a440-notated.jpg

Original file (1,616 × 708 pixels, file size: 626 KB, MIME type: image/jpeg)
| This is a file from the Wikimedia Commons. Information from its description page there is shown below. Commons is a freely licensed media file repository. You can help. |
| DescriptionDissonance-a220-a440-notated.jpg |
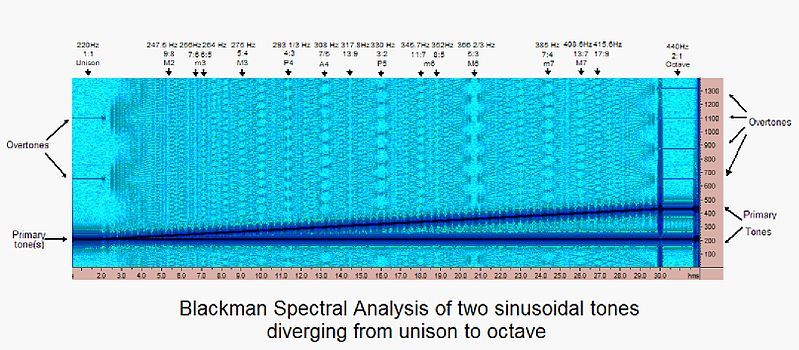
English: This graph shows a spectral analysis of two tones as they diverge from unison to octave.
The spectral analysis shows two sinusoidal tones. The tones remain in unison (220Hz) for the first two seconds of the graph. From the 2nd through the 30th second, the upper tone moves linearly upwards from 220Hz to 440 Hz, while the lower tone remains at 220Hz. For the final two seconds of the graph, the tones remain stable at one octave (220Hz and 440Hz). On this graph, darker colors indicate frequencies that are stronger. The two fundamental tones are indicated by the two darkest lines near the bottom of the graph. Overtones are indicated by the lines and patterns above these two lines. When the frequency ratio between the two tones approaches a simple fraction (3:2, 4:3, 5:4, etc.), the overtone pattern above the two tones at that point converges to a simpler and stronger pattern. Most listeners perceive these as points of greater "purity" or "harmoniousness" in the sound. It is generally considered that these are points of greater consonance, and in general the lower the numbers that are involved in the ratio, the greater the consonance. For instance, a 3:2 interval would be considered more consonant than a 4:3 interval, which itself would be more consonant than a 5:4 interval, and so on. A few of the strongest points of consonance are indicate by arrows and the ratio between the frequencies of the upper tone and the lower tone is indicated. On the graph it can be observed that there is a general correlation between the ratio of the frequencies involved and the number and spacing of the overtones that correspond to those ratios. In between the points where the two tones approach a simple fraction (and thus are generally considered to be relatively consonant), the overtone picture on the graph appears more chaotic and jumbled. Most listeners hear a "roughness" or "disharmony" in the sound at these points. It is generally considered that these are points of greater dissonance. Musical intervals made by the two tones are indicated at the appropriate points. Note that the exact placement of these intervals varies, depending on the tuning system used. In particular, under equal temperament the intervals m3 and m6 lie partway between the two arrows indicated. |
||||||||
| Date | |||||||||
| Source | This file created by Brent Hugh using Cool Edit Pro ver 1.2a. | ||||||||
| Author | Brent Hugh | ||||||||
| Permission (Reusing this file) |
|
||||||||
| Other versions | pt alternate: File:Dissonancia-a220-a440.jpg, Image:Dissonance-a220-a440-notated.jpg, File:Dissonance-a220-a440-slide.ogg, File:Dissonance-a220-a440-slide-sawtooth.ogg, File:Dissonance A220-A440 bandlimited sawtooths dBV2.png |
Captions
Items portrayed in this file
depicts
30 August 2004
File history
Click on a date/time to view the file as it appeared at that time.
| Date/Time | Thumbnail | Dimensions | User | Comment | |
|---|---|---|---|---|---|
| current | 15:04, 6 January 2007 |  | 1,616 × 708 (626 KB) | Penpen~commonswiki | {{:en:Image:Dissonance-a220-a440-notated.jpg}} |
File usage
Metadata
This file contains additional information, probably added from the digital camera or scanner used to create or digitize it.
If the file has been modified from its original state, some details may not fully reflect the modified file.
| _error | 0 |
|---|

