File:Complex log mapping.svg
Page contents not supported in other languages.
Tools
Actions
General
In other projects
Appearance

Size of this PNG preview of this SVG file: 800 × 400 pixels. Other resolutions: 320 × 160 pixels | 640 × 320 pixels | 1,024 × 512 pixels | 1,280 × 640 pixels | 2,560 × 1,280 pixels | 1,000 × 500 pixels.
Original file (SVG file, nominally 1,000 × 500 pixels, file size: 1.51 MB)
| This is a file from the Wikimedia Commons. Information from its description page there is shown below. Commons is a freely licensed media file repository. You can help. |
Summary
| DescriptionComplex log mapping.svg |
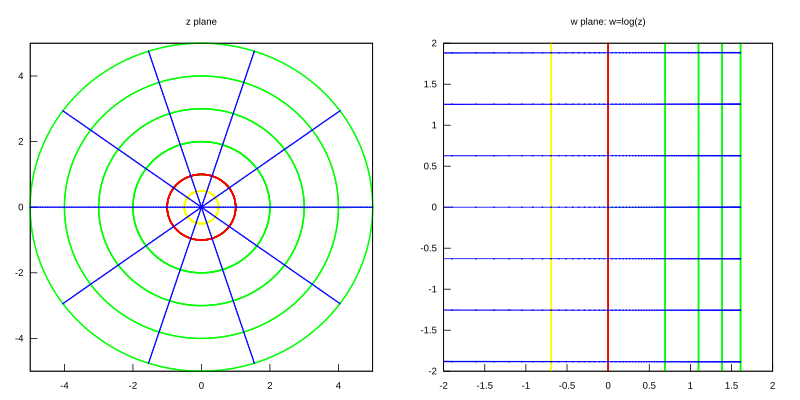
English: Complex log mapping maps radii to horizontal lines and circles to vertical lines.
The principal branch
|
| Date | |
| Source | Own work |
| Author | Soul windsurfer |
| Other versions |
|
| Source code InfoField | Created using Maxima.
/*

 b batch file for maxima


There are 2 complex planes :
* w-plane
* z-plane


z is a pont of z-planes
zz is a list of z points
zzz is a list of zz lists

1. draw cufves on z plane
2. draw images of z-curves  under h  on w plane
3. draw images of w-curves under hi on z plane


http://math.stackexchange.com/questions/114733/mapping-half-plane-to-unit-disk

Adam Majewski

*/

kill(all);
remvalue(all);
display2d:false$


/* definitions of  functions  */


/*  map from z to w : w=h(z) */
h(z):=if z=0.0 then -1000 else rectform(float(log(z))); /* map from z plane to w plane : w = h(z) */


/* converts complex number into list for draw package  */
draw_format(z):= [float(realpart(z)),float(imagpart(z))];


GiveCirclePoint(t) := rectform(float(R*%e^(%i*t*2*%pi))); /* gives point of unit circle for angle t in turns */
GiveZRayPoint(R) := rectform(float(R*%e^(%i*tRay*2*%pi))); /* gives point of external ray for radius R and angle tRay in turns */


compile(all);


R_max: 5;
R_min: 0;
dR: R_max - R_min;
NumberOfRays: 10;
iMax: 100; /* number of points to draw */


print (" ============== compute ===============  ")$

/* curve is a list of points joned by lines */

/* f_0 plane = z-plane */
circle_angles: makelist(i/(10*iMax), i, 0, 10*iMax-1)$ /* more angles = more points */


/* Unit circle */
R: 1;
UnitCirclePointsZ: map(GiveCirclePoint, circle_angles)$
/* circle with radius 1/2 */
R: 0.5;
HalfUnitCirclePointsZ: map(GiveCirclePoint, circle_angles)$


/* External circles */
circle_radii: makelist(R_min+i, i, 1, dR);
ZCirclesPoints: [];
for R in circle_radii do
	ZCirclesPoints: append(ZCirclesPoints, map(GiveCirclePoint, circle_angles))$

/* External W rays */
ray_radii: makelist(R_min+dR*i/iMax, i, 0, iMax)$
ray_angles: makelist(i/NumberOfRays, i, 0, NumberOfRays-1)$
ZRaysPoints: [];
for tRay in ray_angles do
	ZRaysPoints: append(ZRaysPoints, map(GiveZRayPoint, ray_radii))$


 /* --------- map from z to w plane using h  -------------------------------*/

 /* w-curves = images of z-circles */
 WCirclesPoints: map (h, ZCirclesPoints)$
 WRaysPoints: map (h, ZRaysPoints )$
 UnitCirclePointsW : map(h,UnitCirclePointsZ)$
 HalfUnitCirclePointsW : map (h, HalfUnitCirclePointsZ)$
 /* w-curves = images of z-rays */


print ("--------------  convert lists of complex points to draw format lists ----------- ")$
 UnitCirclePointsZ : map (draw_format, UnitCirclePointsZ)$
 HalfUnitCirclePointsZ : map ( draw_format, HalfUnitCirclePointsZ)$
 ZCirclesPoints:map(draw_format,ZCirclesPoints)$
 ZRaysPoints:map(draw_format,ZRaysPoints)$


 WCirclesPoints:map(draw_format, WCirclesPoints)$
 WRaysPoints:map(draw_format, WRaysPoints)$
 UnitCirclePointsW : map (draw_format, UnitCirclePointsW)$
 HalfUnitCirclePointsW : map(draw_format, HalfUnitCirclePointsW)$
/* images of  z-lines */


print (" ------------------  draw ------------------------------------------------------ ")$

path:"~/Dokumenty/maxima/log_map/"$ /* pwd  */
 FileName:"i"$ /* without extension which is the terminal name */

 load(draw); /* Mario Rodríguez Riotorto   http://www.telefonica.net/web2/biomates/maxima/gpdraw/index.html */
 draw(
  terminal  = 'svg,
  file_name = concat(path,FileName),
  columns  = 2,
  dimensions=[1000,500], /*  x = y*columns  */

  gr2d(title = " z plane ",
  /*
   yrange = [-3,3],
   xrange = [-3,3],
   */
   points_joined =true,
   grid = false,

   point_size    = 0.2,
   point_type = filled_circle,
   color 	= green,
   points(ZCirclesPoints),
   color         = red,
   points(UnitCirclePointsZ),
   color = yellow,
   points(HalfUnitCirclePointsZ),
   color = blue,
   points(ZRaysPoints)

  ),

  gr2d(
   title = " w plane: w=log(z)",
   yrange = [-2.0,2.0],
   xrange = [-2.0,2.0],
   grid = false,
   xaxis       = false,

   points_joined =true,

   color         = red,
   point_size    = 0.2,
   point_type = filled_circle,
   color 	= green,
   points(WCirclesPoints),
   color         = red,
   points(UnitCirclePointsW),
   color = yellow,
   points(HalfUnitCirclePointsW),

   color = blue,
   points(WRaysPoints)

)
 );
|
Licensing
I, the copyright holder of this work, hereby publish it under the following license:
This file is licensed under the Creative Commons Attribution-Share Alike 4.0 International license.
- You are free:
- to share – to copy, distribute and transmit the work
- to remix – to adapt the work
- Under the following conditions:
- attribution – You must give appropriate credit, provide a link to the license, and indicate if changes were made. You may do so in any reasonable manner, but not in any way that suggests the licensor endorses you or your use.
- share alike – If you remix, transform, or build upon the material, you must distribute your contributions under the same or compatible license as the original.
- ↑ Strictly speaking, the point on each circle on the negative real axis should be discarded, or the principal value should be used there.
Captions
Complex log mapping
some value
21 September 2023
image/svg+xml
39312848a98e125461ecf1adea99dc401f0317e5
1,586,653 byte
500 pixel
1,000 pixel
File history
Click on a date/time to view the file as it appeared at that time.
| Date/Time | Thumbnail | Dimensions | User | Comment | |
|---|---|---|---|---|---|
| current | 19:20, 21 September 2023 |  | 1,000 × 500 (1.51 MB) | Soul windsurfer | Uploaded own work with UploadWizard |
File usage
The following page uses this file:
Global file usage
The following other wikis use this file:
- Usage on en.wikibooks.org
Metadata
This file contains additional information, probably added from the digital camera or scanner used to create or digitize it.
If the file has been modified from its original state, some details may not fully reflect the modified file.
| Short title | Gnuplot |
|---|---|
| Image title | Produced by GNUPLOT 5.4 patchlevel 2 |
| Width | 1000 |
| Height | 500 |
Retrieved from "https://en.wikipedia.org/wiki/File:Complex_log_mapping.svg"


