File:Cellcycle and growth.png
Cellcycle_and_growth.png (550 × 210 pixels, file size: 20 KB, MIME type: image/png)
| This is a file from the Wikimedia Commons. Information from its description page there is shown below. Commons is a freely licensed media file repository. You can help. |
Summary
| DescriptionCellcycle and growth.png |
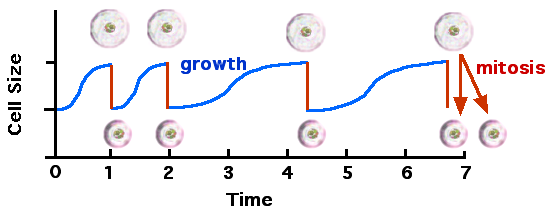
English: The relationship between cell division and cell size. Source: I made this diagam with ClarisDraw and PhotoShop. |
| Date | 2 April 2004 (original upload date) |
| Source | Transferred from en.wikipedia to Commons by Kelly using CommonsHelper. |
| Author | JWSchmidt at English Wikipedia |
Licensing
| This file is licensed under the Creative Commons Attribution-Share Alike 3.0 Unported license. Subject to disclaimers. | ||
| Attribution: JWSchmidt at the English-language Wikipedia | ||
| ||
| This licensing tag was added to this file as part of the GFDL licensing update.http://creativecommons.org/licenses/by-sa/3.0/CC BY-SA 3.0Creative Commons Attribution-Share Alike 3.0truetrue |

|
Permission is granted to copy, distribute and/or modify this document under the terms of the GNU Free Documentation License, Version 1.2 or any later version published by the Free Software Foundation; with no Invariant Sections, no Front-Cover Texts, and no Back-Cover Texts. A copy of the license is included in the section entitled GNU Free Documentation License. Subject to disclaimers.http://www.gnu.org/copyleft/fdl.htmlGFDLGNU Free Documentation Licensetruetrue |
Original upload log
- 2004-04-06 16:05 JWSchmidt 550×210× (20781 bytes)
- 2004-04-02 05:05 JWSchmidt 544×219× (20479 bytes) The relationship between cell division and cell size.
During the cell cycle, major bulk parameters such as volume, dry mass, total protein, and total RNA double and such growth is a fundamental property of the cell cycle. The patterns of growth in volume and total protein or RNA provide an "envelope" that contains and may restrict the gear wheels. The main parameters of cell cycle growth were established in the earlier work when people moved from this field to the reductionist approaches of molecular biology, but very little is known on the patterns of metabolism. Most of the bulk properties of cells show a continuous increase during the cell cycle, although the exact pattern of this increase may vary. Since the earliest days, there have been two popular models, based on an exponential increase and linear increase. In the first, there is no sharp change in the rate of increase through the cycle but a smooth increase by a factor of two. In the second, the rate of increase stays constant through much of the cycle but it doubles sharply at a rate change point (RCP). It is thought that the exponential increase is caused by the steady growth of ribosome numbers and the linear pattern is caused by a doubling of the structural genes during the S period giving an RCP--a "gene dosage" effect. In budding yeast, there are experiments fitting both models but on balance slightly favoring "gene dosage." In fission yeast, there is no good evidence of exponential increase. All the bulk properties, except O2 consumption, appear to follow linear patterns with an RCP during the short S period. In addition, there is in wild-type cells a minor RCP in G2 where the rate increases by 70%. In mammalian cells, there is good but not extensive evidence of exponential increase. In Escherichia coli, exponential increase appears to be the pattern. There are two important points: First, some proteins do not show peaks of periodic synthesis. If they show patterns of exponential increase both they and the total protein pattern will not be cell cycle regulated. However, if the total protein pattern is not exponential, then a majority of the individual proteins will be so regulated. If this majority pattern is linear, then it can be detected from rate measurements on total protein. However, it would be much harder at the level of individual proteins where the methods are at present not sensitive enough to detect a rate change by a factor of two. At a simple level, it is only the exponential increase that is not cell cycle regulated in a synchronous culture. The existence of a "size control" is well known and the control has been studied for a long time, but it has been remarkably resistant to molecular analysis. The attainment of a critical size triggers the periodic events of the cycle such as the S period and mitosis. This control acts as a homeostatic effector that maintains a constant "average" cell size at division through successive cycles in a growing culture. It is a vital link coordinating cell growth with periodic events of the cycle. A size control is present in all the systems and appears to operate near the start of S or of mitosis when the cell has reached a critical size, but the molecular mechanism by which size is measured remains both obscure and a challenge. A simple version might be for the cell to detect a critical concentration of a gene
Captions
Items portrayed in this file
depicts
2 April 2004
image/png
dea0cb3761a04f686bc845212d6d92d94ac43931
20,781 byte
210 pixel
550 pixel
File history
Click on a date/time to view the file as it appeared at that time.
| Date/Time | Thumbnail | Dimensions | User | Comment | |
|---|---|---|---|---|---|
| current | 07:03, 29 December 2010 | 550 × 210 (20 KB) | File Upload Bot (Magnus Manske) | {{BotMoveToCommons|en.wikipedia|year={{subst:CURRENTYEAR}}|month={{subst:CURRENTMONTHNAME}}|day={{subst:CURRENTDAY}}}} {{Information |Description={{en|The relationship between cell division and cell size. Source: I made this diagam with ClarisDraw and P |
File usage
The following 2 pages use this file:
Global file usage
The following other wikis use this file:
- Usage on bs.wikipedia.org
- Usage on gl.wikipedia.org
- Usage on uk.wikipedia.org

