File:Burroughs 2022 soybean temp curves.jpeg
Appearance
Burroughs_2022_soybean_temp_curves.jpeg (520 × 491 pixels, file size: 50 KB, MIME type: image/jpeg)
File history
Click on a date/time to view the file as it appeared at that time.
| Date/Time | Thumbnail | Dimensions | User | Comment | |
|---|---|---|---|---|---|
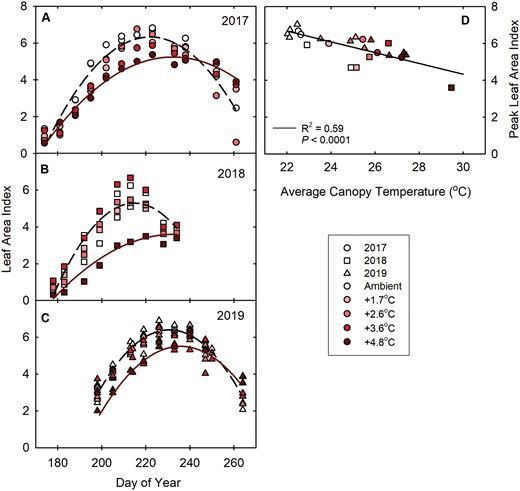
| current | 10:09, 1 October 2023 |  | 520 × 491 (50 KB) | InformationToKnowledge | This graph from [https://academic.oup.com/jxb/article/74/5/1629/6961021 Burroughs et al., 2022] shows the response of soybean plants to increasing temperatures. It is [https://s100.copyright.com/AppDispatchServlet?publisherName=OUP&publication=1460-2431&title=Reductions%20in%20leaf%20area%20index%2C%20pod%20production%2C%20seed%20size%2C%20and%20harvest%20index%20drive%20yield%20loss%20to%20high%20temperatures%20in%20soybean&publicationDate=2022-12-26&volumeNum=74&issueNum=5&author=Burrou... |
File usage
The following page uses this file:
Global file usage
The following other wikis use this file:
- Usage on bn.wikipedia.org


