Jump to content

File:ACOT9 Expression Chart.png

Page contents not supported in other languages.
This is a file from the Wikimedia Commons
From Wikipedia, the free encyclopedia

Original file (732 × 756 pixels, file size: 257 KB, MIME type: image/png)

Summary

Description
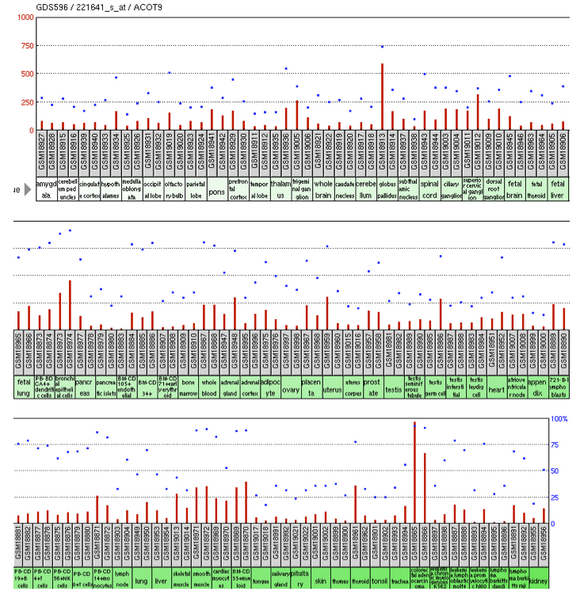
English: ACOT9 Expression Chart
Date
Source https://www.ncbi.nlm.nih.gov/geo/tools/profileGraph.cgi?ID=GDS596:221641_s_at
Author National Center for Biotechnical Information

Licensing

Public domain This image is from the Science Primer a work of the National Center for Biotechnology Information, part of the National Institutes of Health. As a work of the U.S. federal government, the image is in the public domain in the United States.

Captions

Add a one-line explanation of what this file represents

Items portrayed in this file

depicts

9 May 2014

image/png

ab8cc9d109572fe54ba3fe0da5efef4c78994d01

263,062 byte

756 pixel

732 pixel

File history

Click on a date/time to view the file as it appeared at that time.

Date/TimeThumbnailDimensionsUserComment
current03:00, 10 May 2014Thumbnail for version as of 03:00, 10 May 2014732 × 756 (257 KB)Beckx385User created page with UploadWizard

The following page uses this file:

Metadata