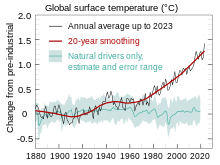
File:2017 Global warming attribution - based on NCA4 Fig 3.3 - single-panel version.png
Appearance

Size of this preview: 800 × 600 pixels. Other resolutions: 320 × 240 pixels | 640 × 480 pixels | 1,024 × 768 pixels | 1,280 × 960 pixels | 2,560 × 1,920 pixels | 3,000 × 2,250 pixels.
Original file (3,000 × 2,250 pixels, file size: 241 KB, MIME type: image/png)
File history
Click on a date/time to view the file as it appeared at that time.
| Date/Time | Thumbnail | Dimensions | User | Comment | |
|---|---|---|---|---|---|
| current | 21:54, 6 January 2022 |  | 3,000 × 2,250 (241 KB) | RCraig09 | Version E: Moving Observed Global Warming trace back up, since in the source its trace started 0.3 degrees F below where the Human Forces trace started; now comparing two traces accurately. Also added Celsius scale at right, and made traces mutually distinct even for colorblindness. |
| 04:08, 15 April 2021 |  | 3,070 × 2,582 (274 KB) | RCraig09 | Version D: reducing file size at tinypng.com | |
| 14:33, 23 February 2020 |  | 3,070 × 2,582 (1.05 MB) | RCraig09 | Version C: removing artifacts | |
| 21:12, 22 February 2020 |  | 3,104 × 2,605 (668 KB) | RCraig09 | VERSION B: Moved global surface temperature (GST) trace down to correctly match 1901-1960 base period that's in the NCA4 Fig. 3.3 reference. . . . Slightly reducing size of text legends for three natural forces, to accommodate lowering of gray GST trace. | |
| 18:46, 13 February 2020 |  | 3,183 × 2,632 (681 KB) | RCraig09 | User created page with UploadWizard |
File usage
The following 5 pages use this file:


