Jump to content

File:2008-tornado-summary-chart.png

Page contents not supported in other languages.
This is a file from the Wikimedia Commons
From Wikipedia, the free encyclopedia

Original file (1,000 × 650 pixels, file size: 61 KB, MIME type: image/png)

Summary

Description
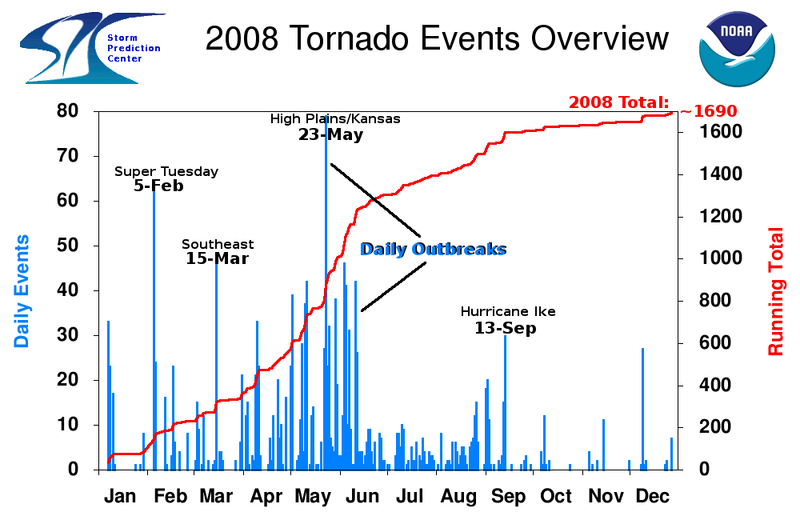
English: A chart showing the daily tornado totals in the United States during 2008
Date
Source http://www.spc.noaa.gov/wcm/2008-summary-chart.png
Author Storm Prediction Center and National Oceanic and Atmospheric Administration
Permission
(Reusing this file)
Public Domain

Licensing

Public domain
This image is in the public domain because it contains materials that originally came from the U.S. National Oceanic and Atmospheric Administration, taken or made as part of an employee's official duties.

العربية  čeština  Deutsch  Zazaki  English  español  eesti  suomi  français  hrvatski  magyar  italiano  日本語  한국어  македонски  മലയാളം  Plattdüütsch  Nederlands  polski  português  română  русский  sicilianu  slovenščina  Türkçe  Tiếng Việt  简体中文  繁體中文  +/−

Captions

Add a one-line explanation of what this file represents

Items portrayed in this file

depicts

image/png

75b91548ea6d39e8e94540e20d0b6afe4a89e015

62,972 byte

650 pixel

1,000 pixel

File history

Click on a date/time to view the file as it appeared at that time.

Date/TimeThumbnailDimensionsUserComment
current17:32, 7 January 2009Thumbnail for version as of 17:32, 7 January 20091,000 × 650 (61 KB)Cyclonebiskit{{Information |Description={{en|1=A chart showing the daily tornado totals in the United States during 2008}} |Source=http://www.spc.noaa.gov/wcm/2008-summary-chart.png |Author=Storm Prediction Center and National Oceanic and Atmospheric Administration |D

The following page uses this file:

Global file usage

The following other wikis use this file:

Metadata