Fraunhofer lines

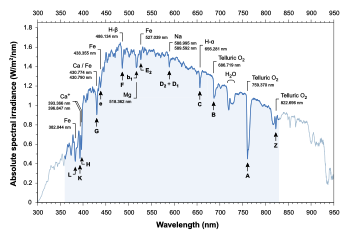
The Fraunhofer lines are a set of spectral absorption lines. They are dark absorption lines, seen in the optical spectrum of the Sun, and are formed when atoms in the solar atmosphere absorb light being emitted by the solar photosphere. The lines are named after German physicist Joseph von Fraunhofer, who observed them in 1814.
Discovery
[edit]
In 1802, English chemist William Hyde Wollaston[2] was the first person to note the appearance of a number of dark features in the solar spectrum.[3] In 1814, Joseph von Fraunhofer independently rediscovered the lines and began to systematically study and measure their wavelengths. He mapped over 570 lines, designating the most prominent with the letters A through K and weaker lines with other letters.[4][5][6] Modern observations of sunlight can detect many thousands of lines.
About 45 years later, Gustav Kirchhoff and Robert Bunsen[7] noticed that several Fraunhofer lines coincide with characteristic emission lines identified in the spectra of heated chemical elements.[8] They inferred that dark lines in the solar spectrum are caused by absorption by chemical elements in the solar atmosphere.[9] Some of the other observed features were instead identified as telluric lines originating from absorption by oxygen molecules in the Earth's atmosphere.
Sources
[edit]The Fraunhofer lines are typical spectral absorption lines. Absorption lines are narrow regions of decreased intensity in a spectrum, which are the result of photons being absorbed as light passes from the source to the detector. In the Sun, Fraunhofer lines are a result of gas in the Sun's atmosphere and outer photosphere. These regions have lower temperatures than gas in the inner photosphere, and absorbs some of the light emitted by it.
Naming
[edit]The major Fraunhofer lines, and the elements they are associated with, are shown in the following table:

For photometry and colorimetry, standard measurements are usually carried out in the range 360–830 nm. From these data and for this spectral range, the correlated color temperature (CCT) is 5470 K.
|
|

The Fraunhofer C, F, G′, and h lines correspond to the alpha, beta, gamma, and delta lines of the Balmer series of emission lines of the hydrogen atom. The Fraunhofer letters are now rarely used for those lines.
The D1 and D2 lines form a pair known as the "sodium doublet", the centre wavelength of which (589.29 nm) is given the designation letter "D". This historical designation for this line has stuck and is given to all the transitions between the ground state and the first excited state of the other alkali atoms as well. The D1 and D2 lines correspond to the fine-structure splitting of the excited states.
The Fraunhofer H and K letters are also still used for the calciumII doublet in the violet part of the spectrum, important in astronomical spectroscopy.
There is disagreement in the literature for some line designations; for example, the Fraunhofer d line may refer to the cyan iron line at 466.814 nm, or alternatively to the yellow helium line (also labeled D3) at 587.5618 nm. Similarly, there is ambiguity regarding the e line, since it can refer to the spectral lines of both iron (Fe) and mercury (Hg). In order to resolve ambiguities that arise in usage, ambiguous Fraunhofer line designations are preceded by the element with which they are associated (e.g., Mercury e line and Helium d line).
Because of their well-defined wavelengths, Fraunhofer lines are often used to specify standard wavelengths for characterising the refractive index and dispersion properties of optical materials.
See also
[edit]- Abbe number, measure of glass dispersion defined using Fraunhofer lines
- Timeline of solar astronomy
- Spectrum analysis
References
[edit]- ^ Starr, Cecie (2005). Biology: Concepts and Applications. Thomson Brooks/Cole. p. 94. ISBN 978-0-534-46226-0.
- ^ Melvyn C. Usselman: William Hyde Wollaston Encyclopædia Britannica, retrieved 31 March 2013
- ^ William Hyde Wollaston (1802) "A method of examining refractive and dispersive powers, by prismatic reflection," Philosophical Transactions of the Royal Society, 92: 365–380; see especially p. 378.
- ^ Hearnshaw, J.B. (1986). The analysis of starlight. Cambridge: Cambridge University Press. p. 27. ISBN 978-0-521-39916-6.
- ^ Joseph Fraunhofer (1814 - 1815) "Bestimmung des Brechungs- und des Farben-Zerstreuungs - Vermögens verschiedener Glasarten, in Bezug auf die Vervollkommnung achromatischer Fernröhre" (Determination of the refractive and color-dispersing power of different types of glass, in relation to the improvement of achromatic telescopes), Denkschriften der Königlichen Akademie der Wissenschaften zu München (Memoirs of the Royal Academy of Sciences in Munich), 5: 193–226; see especially pages 202–205 and the plate following page 226.
- ^ Jenkins, Francis A.; White, Harvey E. (1981). Fundamentals of Optics (4th ed.). McGraw-Hill. p. 18. ISBN 978-0-07-256191-3.
- ^ See:
- Gustav Kirchhoff (1859) "Ueber die Fraunhofer'schen Linien" (On Fraunhofer's lines), Monatsbericht der Königlichen Preussische Akademie der Wissenschaften zu Berlin (Monthly report of the Royal Prussian Academy of Sciences in Berlin), 662–665.
- Gustav Kirchhoff (1859) "Ueber das Sonnenspektrum" (On the sun's spectrum), Verhandlungen des naturhistorisch-medizinischen Vereins zu Heidelberg (Proceedings of the Natural History / Medical Association in Heidelberg), 1 (7) : 251–255.
- ^ G. Kirchhoff (1860). "Ueber die Fraunhofer'schen Linien". Annalen der Physik. 185 (1): 148–150. Bibcode:1860AnP...185..148K. doi:10.1002/andp.18601850115.
- ^ G. Kirchhoff (1860). "Ueber das Verhältniss zwischen dem Emissionsvermögen und dem Absorptionsvermögen der Körper für Wärme und Licht" [On the relation between the emissive power and the absorptive power of bodies towards heat and light]. Annalen der Physik. 185 (2): 275–301. Bibcode:1860AnP...185..275K. doi:10.1002/andp.18601850205.
Further reading
[edit]- Myles W. Jackson; Albert Gallatin Research Excellence Professor of the History of Science at Nyu-Gallatin and Professor Myles W Jackson (2000). Spectrum of Belief: Joseph Von Fraunhofer and the Craft of Precision Optics. MIT Press. ISBN 978-0-262-10084-7.
External links
[edit]
