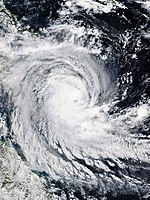
2018–19 Australian region cyclone season
| 2018–19 Australian region cyclone season | |
|---|---|
 Season summary map | |
| Seasonal boundaries | |
| First system formed | 26 September 2018 |
| Last system dissipated | 18 May 2019 |
| Strongest storm | |
| Name | Veronica |
| • Maximum winds | 215 km/h (130 mph) (10-minute sustained) |
| • Lowest pressure | 928 hPa (mbar) |
| Seasonal statistics | |
| Tropical lows | 24 |
| Tropical cyclones | 11 |
| Severe tropical cyclones | 5 |
| Total fatalities | 14 total |
| Total damage | $1.68 billion (2019 USD) |
| Related articles | |
The 2018–19 Australian region cyclone season was an average season that saw the formation of 11 tropical cyclones, six of which intensified further to become severe tropical cyclones. The season officially began on 1 November 2018 and concluded on 30 April 2019; however, as evidenced by Tropical Low Liua in September 2018 and Tropical Cyclones Lili and Ann in May 2019, tropical cyclones can form at any time of the year. As such, any system existing between 1 July 2018 and 30 June 2019 would count towards the season total. During the season, tropical cyclones were officially monitored by the Bureau of Meteorology (BOM), the Indonesian Agency for Meteorology, Climatology and Geophysics (BMKG) in Jakarta, Indonesia, and the National Weather Service of Papua New Guinea in Port Moresby. The United States' Joint Typhoon Warning Center (JTWC) in Hawaii, and other national meteorological services such as MetService in New Zealand, Météo-France at La Réunion, and the Fiji Meteorological Service (FMS), also monitored parts of the basin during the season in an unofficial capacity.
This was the first Australian tropical cyclone season since 2014–15 to feature at least six severe tropical cyclones. It was also the third season in a row to begin prior to the official commencement date of 1 November, in this instance with the development of Tropical Low Liua on 26 September 2018. The most active month was December 2018, with a total of seven tropical lows existing in the region at some time during the month. The three strongest storms of the season—Veronica, Trevor and Savannah—all developed in March 2019, and together affected all three of the Bureau of Meteorology's Australian sub-regions as severe tropical cyclones. Overall, a total of five tropical cyclones existed within each of the three sub-regions throughout the season, representing an above-average season for both the Eastern Region and the Northern Region, but a below-average season for the Western Region. The season concluded much later than usual, and well after the official ending date of 30 April. Two tropical cyclones developed during May—Lili in the eastern Indonesian archipelago and Ann in the Coral Sea—both of which made landfall as tropical lows after weakening from tropical cyclone intensity. At its peak, Ann was a Category 2 tropical cyclone, and was the strongest storm to form in the Australian region during May since Severe Tropical Cyclone Rhonda in 1997. In total, eight systems were named by the BOM during the season, with two named by the BMKG and one by the FMS.
Seasonal forecasts
[edit]| Region | Average number |
Chance of more |
Chance of less |
Actual activity |
|---|---|---|---|---|
| Whole | 11 | 37% | 63% | 11 |
| Western | 7 | 44% | 56% | 5 |
| North-Western | 5 | 41% | 59% | 4 |
| Northern | 3 | 46% | 54% | 5 |
| Eastern | 4 | 40% | 60% | 5 |
| Source: BOM's Seasonal Outlooks for Tropical Cyclones.[1] | ||||
During October, ahead of the tropical cyclone season, the Bureau of Meteorology issued a tropical cyclone outlook for the upcoming 2018–19 season, which would officially run from 1 November 2018 to 30 April 2019. Seasonal forecasts were issued for the basin as a whole, as well as the Eastern, Northern and Western regions and the North-Western sub-region.[1] The forecasts took into account various factors, including the latest neutral to weak El Niño conditions that had been observed in the tropical Pacific Ocean.[1]
The outlooks showed that activity in the basin overall, as well as for each of its individual regions, would be near to below average.[1] For the Western region between 90°E and 125°E, the BOM forecast that the area would also see activity below its average of 7, with a 56% chance of a below average number of tropical cyclones occurring.[1] TCWC Perth also noted that there was a likelihood of two tropical cyclones and a significant likelihood of at least one severe tropical cyclone impacting Western Australia.[2] For the North-Western sub-region between 105°E and 130°E, it was predicted that activity would be above average, with a 41% chance of below-average tropical cyclone activity.[1] The Northern Territory, which was defined as being between as being 125°E and 142.5°E, had a 54% chance of an above-average season.[1] The Eastern region between 142.5°E and 160°E was predicted to have a below-normal tropical cyclone season, with a 60% chance of below-average tropical cyclone activity.[1]
Seasonal summary
[edit]
Systems
[edit]Tropical Low Liua
[edit]| Category 1 tropical cyclone (Australian scale) | |
| Duration | 26 September – 29 September (Out of basin on 27 September) |
|---|---|
| Peak intensity | 85 km/h (50 mph) (10-min); 993 hPa (mbar) |
During September 24, the JTWC started to monitor a tropical disturbance, that had developed about 990 km (615 mi) to the east-northeast of Port Moresby in Papua New Guinea.[3] The system moved southeastwards over the following few days, and was classified as a tropical depression by the Fiji Meteorological Service on 26 September while situated on the boundary between the Australian basin and the South Pacific basin.[4][5] The system proceeded to intensify into a category 1 tropical cyclone on the Australian scale, and was named 'Liua' by the Fiji Meteorological Service.[6] The system turned westwards and began tracking back towards the Australian region the next day,[7] but was assessed as having weakened into a tropical depression prior to exiting the South Pacific basin on 28 September.[8] After re-entering the Australian region, Ex-Tropical Cyclone Liua's weakening trend continued due to unfavourable atmospheric conditions and the cool sea surface temperatures of early spring. Dissipation of the tropical low into a remnant area of low-pressure occurred the following day over the northern Coral Sea.[9]
While in the Australian region as a tropical low on 26 September, the system caused minor impacts in the Solomon Islands. Despite only existing as a tropical system in the Australian region for a short period of time, Ex-Tropical Cyclone Liua made the 2018–19 season the third in a row in which the region's tropical cyclone activity began prior to the official start date of 1 November.[8][10][11][12]
Tropical Low Bouchra
[edit]| Tropical low (Australian scale) | |
| Tropical storm (SSHWS) | |
| Duration | 9 November – 16 November (Exited basin) |
|---|---|
| Peak intensity | 55 km/h (35 mph) (10-min); 997 hPa (mbar) |
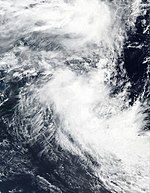
A weak low-pressure system developed in the equatorial Indian Ocean in Météo-France's area of responsibility on 1 November and moved slowly eastwards over the following few days while showing little sign of intensification.[13] Late on 9 November, as the developing precursor depression to Severe Cyclonic Storm Gaja in the Bay of Bengal moved further away and the competing low-level airflow convergence associated with it diminished,[14] the system's structure organised sufficiently to be classified as a tropical disturbance by Météo-France.[15] Soon there-afterwards, the system crossed the 90th meridian east and entered the Australian region, where it was classified by TCWC Jakarta as a tropical depression on 10 November local time.[16] Later the same day, the JTWC assessed the developing low as having attained tropical storm status on the Saffir-Simpson Hurricane Wind Scale, and assigned the system the unofficial designation 04S.[17] A few hours later, at 10:00 UTC, the system moved back westwards and returned to the South-West Indian Ocean basin,[18] where it gained the name 'Bouchra' from Météo-France and underwent a twelve-hour phase of rapid intensification to severe tropical storm status.[19]
After meandering just to the west of the South-West Indian Ocean border for a number of days, the system re-entered the Australian region late on 12 November.[20] By this stage, the system had weakened significantly from its peak intensity, and was only at tropical low strength.[21] The period of residence in the Australian basin proved to be short-lived once again, however, with Météo-France indicating that Ex-Tropical Cyclone Bouchra had returned to the far-eastern part of their area of responsibility early on 13 November.[20] The very next day, the Bureau of Meteorology noted that the system had once again returned to the Australian basin, and was located approximately 1,000 km (620 mi) northwest of the Cocos Islands, marking the tropical low's third period of existence in the Australian region in just five days.[22]
Severe Tropical Cyclone Owen
[edit]| Category 3 severe tropical cyclone (Australian scale) | |
| Category 2 tropical cyclone (SSHWS) | |
| Duration | 29 November – 17 December |
|---|---|
| Peak intensity | 155 km/h (100 mph) (10-min); 956 hPa (mbar) |
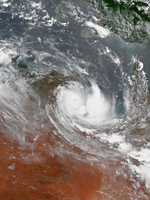
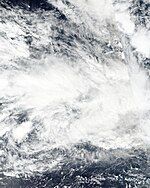
The Bureau of Meteorology noted on 29 November that a low-pressure system located over the Solomon Islands had developed into a tropical low.[23] The following day, as the system approached Tagula Island on a south-westwards track, the Joint Typhoon Warning Center issued a tropical cyclone formation alert as the system improved in organisation.[24] Fuelled by the warm sea surface temperatures of the Coral Sea, and aided by excellent upper outflow channels, the tropical low continued to strengthen.[25] At 06:00 UTC on 2 December, the Bureau of Meteorology upgraded the system to a Category 1 tropical cyclone on the Australian scale, and gave it the name Owen, making it the first tropical cyclone to form in the basin during the season. Owen weakened rapidly on 4 December and was downgraded to a tropical low.[26]
Owen continued travelling westwards over the Coral Sea as a tropical low and made landfall well north of Cardwell, Queensland early on 10 December. After entering the Gulf of Carpentaria and reorganizing, Owen reattained Category 1 intensity on 11 December. The storm then completed an anti-cyclonic loop and turned back to the east. Owen gradually began to intensify, peaking as a Category 3 severe tropical cyclone with maximum 10-minute sustained winds of 150 kilometres per hour (93 mph). Owen made landfall near Kowanyama early on 15 December as a low-end Category 3 severe tropical cyclone and gradually weakened thereafter due to land interaction.[27] That afternoon, Owen was downgraded to a tropical low once more. Late that day, Owen emerged into the Coral Sea once again, before transitioning into a subtropical low on 17 December. Soon afterward, the system restrengthened somewhat, before weakening again on 18 December. Afterward, Owen made a counterclockwise loop towards Australia, while steadily weakening. Owen degenerated into a remnant low on 20 December before dissipating two days later, just off the east coast of northern Queensland.
During the storm's passage over northern Queensland, Owen killed a person and produced steady rainfall throughout the region, with the highest totals predicted for the eastern coast compared to the southwestern portions of the state.[28] Innisfail recorded a daily total of 149 millimetres (5.9 in) of rain on 15 December, with Cowley Beach recording 135 millimetres (5.3 in), Copperlode Falls Dam west of Cairns recording 130 millimetres (5.1 in) and Mission Beach recording 98 millimetres (3.9 in).[29]
Tropical Cyclone Kenanga
[edit]| Category 1 tropical cyclone (Australian scale) | |
| Tropical storm (SSHWS) | |
| Duration | 14 December – 16 December (Exited basin) |
|---|---|
| Peak intensity | 75 km/h (45 mph) (10-min); 995 hPa (mbar) |
On 14 December, a tropical low formed well southwest of Sumatra. After a period of strengthening, it received the name Kenanga as it tracked roughly southwestward. Continuing on this course, it exited the basin on 16 December and subsequently strengthened into an intense tropical cyclone in the South-West Indian Ocean basin.
Tropical Cyclone Penny
[edit]| Category 2 tropical cyclone (Australian scale) | |
| Tropical storm (SSHWS) | |
| Duration | 30 December – 9 January |
|---|---|
| Peak intensity | 95 km/h (60 mph) (10-min); 987 hPa (mbar) |
In an active late December in terms of tropical low formation, the Bureau of Meteorology noted the development of a third weak tropical low[30] in the monsoon trough extending from the tropical waters of the Coral Sea in the east, to the Timor Sea in the west.[31] The revival of monsoonal and related convective activity in the region was associated with a moderate-strength pulse of the Madden–Julian oscillation moving eastwards across the Maritime Continent.[32] The tropical low, officially designated 07U, was located near the eastern coastline of Cape York Peninsula, and was assessed by the Bureau of Meteorology as having a high chance of intensifying to tropical cyclone strength within the next three days, owing to a favourable atmospheric environment.[30]
Tropical Low 07U tracked slowly westwards, and passed over the east coast of Cape York Peninsula on 30 December, south of the town of Lockhart River. At this point, the Bureau of Meteorology issued its first tropical cyclone advice and forecast track map relating to the system.[33] Maintaining its westward motion, the system emerged over the Gulf of Carpentaria very early in the morning of 31 December, crossing the Queensland coast between Aurukun and Weipa, where generally favourable conditions fuelled intensification.[34] Tropical Low 07U turned eastwards at about midday on 31 December, and proceeded to strengthen into a category 1 tropical cyclone on the Australian scale a few hours later, being named ‘Penny’ by the Bureau of Meteorology.[34]
Tropical Cyclone Penny made landfall on the western Cape York Peninsula coastline, just south of Weipa, at approximately 15:30 local time on 1 January,[35] generating maximum ten-minute sustained winds of 75 kilometres per hour (47 mph) near the centre. The system began to weaken as it tracked over land, and was downgraded to a gale-force tropical low a few hours later, with sustained tropical cyclone-strength winds persisting in the system's western semicircle.[35] Thursday Island in the Torres Strait recorded ten-minute sustained winds of at least 41 kilometres per hour (25 mph) for a period of more than 17 hours while the system moved eastwards across Cape York Peninsula, including sustained winds of up to 65 kilometres per hour (40 mph) and gusts to 91 kilometres per hour (57 mph).[36] Ex-Tropical Cyclone Penny crossed the east coast of Far North Queensland at Lockhart River in the early hours of the next morning, bringing the system over the warm waters of the Coral Sea for a second time.[37]
Ex-Tropical Cyclone Penny quickly tracked eastwards across the Coral Sea, while regaining the organisation and convective structure that had been eroded due to land interaction over Cape York Peninsula. At 06:00 UTC on 2 January, the Bureau of Meteorology assessed the system as having regained tropical cyclone structure and intensity, and upgraded it to a Category 1 tropical cyclone.
Tropical Low Mona
[edit]| Tropical low (Australian scale) | |
| Duration | 28 December – 31 December (Exited basin) |
|---|---|
| Peak intensity | 95 km/h (60 mph) (10-min); 996 hPa (mbar) |
A weak tropical low developed in a monsoon trough stretching across the northern Coral Sea on 28 December, situated in the far northeast of the Eastern Region, near the southern Solomon Islands.[30] The system meandered for a few days without any notable intensification, before moving slowly eastwards out of the Australian region late on 31 December.[38] Upon entering the South Pacific basin, the system was classified as Tropical Disturbance 04F by the Fiji Meteorological Service. The system later intensified into Tropical Cyclone Mona on 2 January.
Severe Tropical Cyclone Riley
[edit]| Category 3 severe tropical cyclone (Australian scale) | |
| Category 1 tropical cyclone (SSHWS) | |
| Duration | 19 January – 30 January |
|---|---|
| Peak intensity | 130 km/h (80 mph) (10-min); 970 hPa (mbar) |
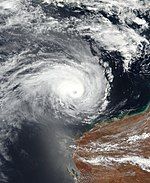
On 22 January, a tropical low formed to the north of Kalumburu. The low slowly strengthened as it moved to the southwest, paralleling to the northwestern Kimberley coast. On 24 January, the low strengthened to Tropical Cyclone Riley, while located to the northwest of Broome. Riley then moved towards the west and was upgraded to Category 2 as it tracked further from the mainland. It further strengthened to a Category 3 Severe Tropical Cyclone, while located to the southwest of Onslow. As it entered an area of dry air and strong wind shear, Riley rapidly degraded to a Category 1 tropical cyclone before degenerating to a tropical low, while located to the southwest of Cocos Islands. Riley's remnants moved to the west, before dissipating entirely over the Indian Ocean.
Tropical Cyclone Advices were issued for the northwest Kimberley coast between Kuri Bay and Beagle Bay and then for the Pilbara coast between Whim Creek and Exmouth. Rowley Shoals reported gale-force winds for periods late on the 24th and during the 25th with a peak gust of 94 kilometres per hour. Overall, Riley caused minimal impacts on the Western Australia.[39]
Tropical Low 13U
[edit]| Tropical low (Australian scale) | |
| Duration | 21 January – 6 February |
|---|---|
| Peak intensity | 55 km/h (35 mph) (10-min); 999 hPa (mbar) |
A tropical low, designated as 13U was identified inland, east of Mapoon on January 23 near a monsoon trough. The system moved westward over the northeastern Gulf of Carpentaria the following day and was forecasted to slowly strengthen. Tropical cyclone advices were issued early for the Gulf Coast, but the system moved back over the Cape York Peninsula near Weipa early on 26 January as it made a loop before it could develop significantly into a tropical cyclone. It moved ashore near Cape Keerweer without further strengthening due to its proximity to land. Tropical Low 13U then moved slowly southwest into the southern Gulf Country, where it stalled for five days between January 31 and February 5 before it was last noted to the west-southwest of Cairns.
The tropical low associated with the monsoon trough brought torrential rainfall associated with floodwaters across the Far North Queensland and the Eastern Coast. It forced the Ross River Dam to release water, which worsened the pre-existing flooding of the Ross River in Townsville. Over 2000 properties in Townsville were flooded, and 3 deaths occurred as a result.[40]
Tropical Cyclone Oma
[edit]| Category 2 tropical cyclone (Australian scale) | |
| Tropical storm (SSHWS) | |
| Duration | 7 February – 22 February (Out of basin between 11-21 and 22 February) |
|---|---|
| Peak intensity | 100 km/h (65 mph) (10-min); 979 hPa (mbar) |
On 7 February, a second tropical low developed within a very active monsoon trough, east of Cardwell on the northern Queensland coast.[41] Environmental conditions over the Coral Sea in the low's vicinity were not particularly favourable for cyclogenesis, however, and the system was forecast by the Bureau of Meteorology as having only a low chance of developing into a tropical cyclone.[41] On 11 February, the system exited the basin and later strengthened into Tropical Cyclone Oma in the South Pacific basin. The system reentered the Australian region basin on 21 February, as a Category 2 tropical cyclone. However, on 22 February, the system exited the Australian region basin and reentered the South Pacific basin.
Large swells from the cyclone impacted large swathes of Queensland for approximately a week. Around Brisbane, the surf caused significant beach erosion; particularly affected was a 16 km (9.9 mi) stretch along Moore Park Beach.[42] More than 30 people required rescue, some of whom were hospitalised, from the turbulent waters.[43] One person drowned just off North Stradbroke Island after attempts to resuscitate him failed (while Oma was in the Australian region basin).[42] Winds up to 80 km/h (50 mph) destroyed approximately A$700,000 (US$500,000) worth of Cavendish bananas in Cudgen, New South Wales.[44]
Severe Tropical Cyclone Savannah
[edit]| Category 4 severe tropical cyclone (Australian scale) | |
| Category 3 tropical cyclone (SSHWS) | |
| Duration | 8 March – 17 March (exited basin) |
|---|---|
| Peak intensity | 175 km/h (110 mph) (10-min); 953 hPa (mbar) |
On 8 March, Tropical Low 17U formed to the south of Bali. Over the next several days, the tropical low drifted west-northwestward, while changing little in intensity. On 12 March, 17U turned southwestward and began to organize, strengthening into Tropical Cyclone Savannah on 13 March. On 16 March, Savannah intensified into a Category 3 severe tropical cyclone, on the Australian region scale. It then reached its peak intensity early on 17 March, with maximum sustained 10-min winds of 175 kilometres per hour (109 mph). Later that day, it exited the basin and moved into the South-West Indian Ocean basin.
As a tropical low, Savannah brought heavy rainfall to Java. A five-year-old child was killed in a car accident in Surabaya.[45] Landslides in Yogyakarta killed 5 individuals and left 1 missing.[46] Flooding in Madiun caused damage of about 54.1 billion rupiah (US$3.78 million), the worst in two decades.[47][48] In Magelang, 4 tourists were killed when they were overcome by flash flooding in a river.[49] Damage due to flooding in several districts of East Java reached 52.2 billion rupiah (US$3.65 million).[50][51][52][53][54] In Klaten and Sukoharjo of Central Java, the damage of the flooding stood at 934 million rupiah (US$65,000).[55][56] Savannah also caused flooding in Bali, with Sawan, Buleleng recorded a damage of 150 million rupiah (US$10,000).[57]
Severe Tropical Cyclone Trevor
[edit]| Category 4 severe tropical cyclone (Australian scale) | |
| Category 3 tropical cyclone (SSHWS) | |
| Duration | 15 March – 26 March |
|---|---|
| Peak intensity | 185 km/h (115 mph) (10-min); 944 hPa (mbar) |
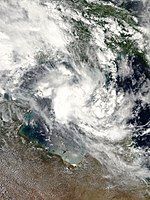
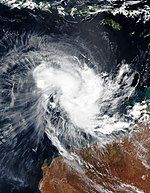
On March 15, a tropical low formed just off the east coast of Papua New Guinea. Over the next couple of days, the tropical low initially moved southeastward, crossing over the southeastern portion of Papua New Guinea on March 16, south of Port Moresby, and then turning southward on March 17. Late on the same day, the tropical low organized into Tropical Cyclone Trevor. Tropical Cyclone Trevor intensified rapidly to a severe category 3 cyclone before crossing the Queensland coast just south of Lockhart River. The cyclone slowed down before turning towards the southwest as it rapidly intensified to a severe category 4 intensity over the warm waters of the Gulf towards the Northern Territory coast. On March 23, it made its second Australian coastal landfall near the Northern Territory/Queensland Border and was subject to weakening. It rapidly degraded inland and it was last noted near Mount Isa on the afternoon of March 26.[58]
A farm in Coen, Queensland suffered losses of at least A$1 million (US$710,000) from the flooding associated with the cyclone, as a result of damage to equipment and loss of cattle.[59]
Severe Tropical Cyclone Veronica
[edit]| Category 5 severe tropical cyclone (Australian scale) | |
| Category 4 tropical cyclone (SSHWS) | |
| Duration | 18 March – 31 March |
|---|---|
| Peak intensity | 215 km/h (130 mph) (10-min); 928 hPa (mbar) |
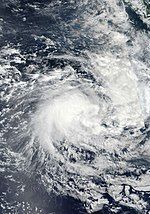
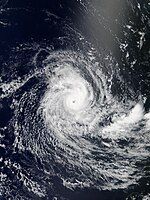
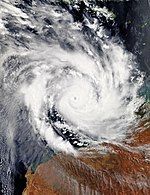
On 18 March, a tropical low formed to the southeast of East Timor. At 03:00 AWST on the morning of 20 March, the Bureau of Meteorology assessed the developing tropical low as having attained tropical cyclone strength, and named the system Veronica. Experiencing extremely favourable atmospheric conditions and very warm sea surface temperatures, Tropical Cyclone Veronica proceeded to intensify rapidly throughout the day, attaining Category 3 status on the Australian scale just 18 hours later.[60]
In preparation for passage of Veronica, major shipping ports on the Pilbara coastline were forced to cease operations in the interests of safety. The port of Port Hedland, the most valuable export hub in Australia and one of the largest iron ore loading ports in the world, was closed on 22 March,[61] with operations only resuming nearly four days later.[62] As a result of the disruption to the mining and export operations, Rio Tinto estimated that its iron ore production would suffer reductions of approximately 14 million tonnes during 2019.[63] Rio Tinto's Cape Lambert port wharf also sustained damage from waves generated by the cyclone, and repairs to the company's Robe River sorting facility following a fire earlier in the year were delayed during the event.[64] Fortescue Metals reported that exports of up to 2 million tonnes of its own iron ore were disrupted during the cyclone.[64] In total, economic costs associated with the mining disruptions and damage caused by Veronica reached A$1.7 billion (US$1.2 billion) in Rio Tinto.[64]
Tropical Cyclone Wallace
[edit]| Category 2 tropical cyclone (Australian scale) | |
| Tropical storm (SSHWS) | |
| Duration | 3 April – 12 April |
|---|---|
| Peak intensity | 100 km/h (65 mph) (10-min); 986 hPa (mbar) |
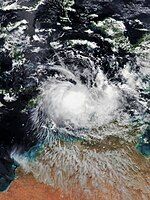
In late March, an increase in cross-equatorial flow from the northern Pacific Ocean led to the redevelopment of the monsoon trough across the tropical waters north of the Australian continent,[65] centered in the Arafura and Coral Seas north of Queensland.[66] On April 1, the trough spawned Tropical Low 21U to the northeast of Darwin, Northern Territory, as well as a short-lived low southeast of Papua New Guinea.[67][68][69][70] The low moved generally west-southwest and produced ample thunderstorms, fueled by a moist atmosphere, strong upper outflow, and warm waters; however, the development was hampered by strong wind shear.[71][72] On 5 April, the JTWC designated the system as Tropical Cyclone 23S.[73] On the same day, the BoM upgraded the low to Tropical Cyclone Wallace, while the storm was about halfway between Timor and the northern coastline of Western Australia.[74] Over the next few days, the intensity fluctuated, and the track shifted more to the southwest, due to a ridge over the Australian mainland.[75][76] During this time, Wallace brought rainfall, high waves, and gusty winds to parts of Indonesia, with sustained winds of 45 kilometres per hour (28 mph) reported on East Nusa Tenggara.[77][78] The BoM issued various cyclone watches and warnings for Australia's northern coast.[79] While off Australia's northwest coast, Wallace dropped heavy rainfall on the mainland, reaching 159.0 mm (6.26 in) at Croker Island, including 52.0 mm (2.05 in) in one hour on 4 April.[80][81] The offshore Browse Island reported sustained winds of 63 kilometres per hour (39 mph), the only location along the storm's path to report sustained gale-force winds.[75][82]
Following a decrease in wind shear, Wallace intensified further, developing symmetrical convection over the center, as well as primitive eye feature. Late on 8 April, the BoM upgraded Wallace to a Category 3, estimating peak winds of 120 kilometres per hour (75 mph), while the storm was located approximately 530 km (330 mi) to the north-northwest of the town of Karratha.[83] The JTWC estimated the same intensity during its storm existence, making Wallace the equivalent of a minimal hurricane but in its post analysis, they later downgraded it into high end tropical storm of 110 kmph windspeed.[84] Drier air and increasing wind shear caused Wallace to weaken. Only 24 hours after the storm's peak intensity, the centre became exposed from the increasingly asymmetric convection.[85][86] On 10 April, the BoM downgraded the storm to a vigorous gale-force tropical low, and the JTWC issued their final advisory on Wallace.[87][88] Wallace continued westward through the Indian Ocean and continued to weaken.[89] The shallow remnant low passed south of the Cocos (Keeling) Islands on 14 April,[90] producing a 24-hour rainfall total of 11.2 mm (0.44 in) at West Island.[91] The low dissipated on 16 April as it approached the eastern border of Météo-France La Réunion's area of responsibility.[92]
Tropical Low 22U
[edit]| Tropical low (Australian scale) | |
| Duration | 5 April – 15 April |
|---|---|
| Peak intensity | 65 km/h (40 mph) (10-min); 1005 hPa (mbar) |
On 5 April, the Bureau of Meteorology reported that Tropical Low 22U had formed in the far northeastern Gulf of Carpentaria.[93] The system began moving westward from the Torres Strait towards the northeastern coast of the Top End without any significant intensification due to generally unfavourable atmospheric conditions for cyclogenesis.[93] The low moved across the Arafura Sea just off the Northern Territory coastline on 6 April,[94] entering the Van Diemen Gulf the following day.[95] As the system tracked generally westwards into the Timor Sea and began to roughly retrace the path that Severe Tropical Cyclone Wallace had taken a few days earlier,[96] the low showed some signs of intensification. However, the atmospheric environment was generally unfavourable for significant strengthening, and the system remained relatively weak and devoid of gale-force winds. The tropical low passed close to Browse Island on 10 April before exiting the Timor Sea, and moving into the Indian Ocean proper.
After moving steadily southwestwards across the Indian Ocean to the northwest of Western Australia for several days, Tropical Low 22U began to approach the western Pilbara district and North West Cape of Western Australia. The Joint Typhoon Warning Center noted that despite wind shear leaving the low-level circulation centre exposed, the tropical low was relatively well-structured, with spiral banding wrapping into well-organised lower layers and a tightly defined centre.[97] Particularly strong sustained winds were present in the southern quadrants of the system due to acceleration by the steep pressure gradient with a surface high-pressure system located to the south.[97] At 00:00 UTC on 14 April, ten-minute sustained winds peaking at 63 kilometres per hour (39 mph) were observed on Varanus Island,[98] located about 60 km (37 mi) northwest of the mainland and 130 km (81 mi) west of the town of Karratha. Although such gale-force winds are equivalent to Category 1 intensity on the Australian scale, the Bureau of Meteorology's definition of a tropical cyclone requires these winds to extend more than halfway around the system's surface circulation for the system to be upgraded from a tropical low.[99]
The tropical low made landfall on the coast of Western Australia near the town of Onslow, to the east of the Exmouth Gulf, on the afternoon of 14 April (local time).[100] By this stage, the system had become trapped beneath strong upper-level westerly flow, which was acting to further displace the remaining fragmented convection to the east of the storm's centre.[101] The weakened and shallow system proceeded eastwards towards the Northern Interior district of Western Australia, while continuing to unravel, dissipating by 05:00 UTC on 15 April, while located over the Great Sandy Desert.[102]
Tropical Low 22U delivered sustained moderate to heavy rainfall to large areas of the Arnhem District during its track across the Gulf of Carpentaria and the Top End. The town of Nhulunbuy received especially large precipitation totals, with the nearby Gove Airport recording 229.6 mm (9.04 in) of rain during the 72-hour period to 09:00 local time (ACST) on 8 April—its largest three-day total since March 2015 during the passage of Cyclone Nathan.[103][104] Central Plateau in the west of the Arnhem Land region also received 81 mm (3.2 in) in the 20-hour period up to 05:00 ACST on 7 April.[105] Browse Island, situated approximately 175 km (109 mi) northwest of Western Australia's Kimberley coastline, experienced relatively strong winds on 10 April as Tropical Low 22U passed nearby, with ten-minute mean winds peaking at 54 kilometres per hour (34 mph), with gusts as high as 69 kilometres per hour (43 mph) also recorded.[106] Upon nearing land in the far western Pilbara, the tropical low delivered moderate rainfall and gusty winds to locations throughout the region's coastal fringe and nearby islands. Varanus Island recorded gusts of up to 87 kilometres per hour (54 mph), coincident with sustained gale-force winds,[98] and gusts reached 65 and 61 kilometres per hour (40 and 38 mph) at Onslow and Barrow Island, respectively.[107][108] Widespread wind gusts in excess of 50 kilometres per hour (31 mph) were observed in numerous areas, including at Roebourne, Mardie, Karratha and Thevenard Island.[109][110][111][112] Learmonth Airport, near Exmouth on the North West Cape, accumulated 37.6 mm (1.48 in) of rainfall in the seven-hour period to 09:00 local time (AWST) on 14 April.[113]
Tropical Low 23U
[edit]| Tropical low (Australian scale) | |
| Duration | 21 April – 26 April |
|---|---|
| Peak intensity | 55 km/h (35 mph) (10-min); 998 hPa (mbar) |
During mid-April, a low-pressure system and its associated low-pressure trough generated heavy precipitation over the central-eastern Indian Ocean, including significant rainfall totals in the region of the Cocos (Keeling) Islands, a populated Australian external territory.[114] On 21 April, as the low began to deepen, the system embedded within the trough was classified by the Bureau of Meteorology as a tropical low, while located southwest of the Indonesian island of Sumatra.[114] The storm moved steadily southwestwards before stalling on 22 April, then assumed a more southerly motion on 24 April.[115] The Joint Typhoon Warning Center classified the system as a tropical depression on 25 April in accordance with the low's improved structure and organisation.[116] It was noted that environmental conditions in the vicinity were largely favourable for continued development, with good poleward upper-level outflow and warm sea surface temperatures, with the only mitigating factor being moderate to high vertical wind shear to the north and south of the low. Organisation proceeded in response to the conducive conditions, with sustained convection and formative cloud banding developing around the consolidating low-level circulation centre.
Despite initial forecasts of a medium chance to develop into a tropical cyclone, the tropical low began to degrade later on 25 April,[117] and it was indicated that the system was unlikely to intensify further.[118] By this stage, the tropical low had commenced a direct binary interaction (consistent with the Fujiwhara Effect) with the significantly stronger Severe Tropical Storm Lorna, located less than ten degrees of longitude to the west, in the South-West Indian Ocean basin.[117] As Lorna tracked east-southeastward towards the Australian region, the low-level circulation of the tropical low began to elongate, with the distribution of deep convective activity becoming increasingly fragmented.[117] Now increasingly displaying features consistent with a vigorous low-pressure trough, the tropical low continued to weaken into 26 April, as it maintained its southward track.[117] Having lost its structure, the Bureau of Meteorology indicated that the storm had dissipated as a tropical low by 06:00 UTC on 26 April.[119] The ex-tropical low was fully absorbed by the intensifying Cyclone Lorna the following day.
The tropical low's track brought the system within a few hundred kilometres of the Cocos Islands on 23–25 April.[118] As a result of the close proximity of the storm, strong winds and moderate rainfall were experienced for an extended period on the islands. At Cocos Islands Airport on West Island, the capital of the Cocos Islands, sustained winds peaked at 59 kilometres per hour (37 mph)—slightly below gale-force—at 11:30 p.m. local time (17:00 UTC) on 24 April, with gusts of up to 76 kilometres per hour (47 mph) also recorded. Including associated heavy rainfall prior to the system's classification as a tropical low,[114] West Island received 457.6 mm (18.02 in) of rainfall from 17 to 27 April.[120]
Tropical Cyclone Lili
[edit]| Category 1 tropical cyclone (Australian scale) | |
| Tropical storm (SSHWS) | |
| Duration | 4 May – 11 May |
|---|---|
| Peak intensity | 75 km/h (45 mph) (10-min); 997 hPa (mbar) |
A moderate to strong pulse of the Madden–Julian oscillation moved eastwards across the Maritime Continent during early May, generating unseasonal monsoonal activity throughout the Indonesian archipelago and far-northern parts of Australia.[121] As this pulse had tracked across the Indian Ocean during the preceding fortnight,[121] it had contributed to the favourable conditions which facilitated the intensification of Extremely Severe Cyclonic Storm Fani in the Bay of Bengal. Similarly, the presence of the pulse in the Maritime Continent generated favourable conditions for cyclogenesis in the tropical seas to the north of the Australian continent,[121] despite May being outside the traditional bounds of the Australian region cyclone season. On 4 May, the Bureau of Meteorology noted the formation of a weak tropical low approximately 750 km (470 mi) to the north-northwest of Darwin, embedded within a low-pressure trough extending from Borneo to New Guinea.[122][123] Over the next few days, the tropical low slowly moved southward over the Banda Sea while its central barometric pressure gradually deepened. Strong flaring convection began to surround the system as its low-level circulation centre consolidated on 7 May, and as a result, the JTWC issued a Tropical Cyclone Formation Alert at 17:30 UTC.[124] Located within an environment regarded as favourable for development, the JTWC forecast the system to strengthen into a tropical storm within the next 24 hours.[124] The tropical low was upgraded to a Category 1 tropical cyclone on the Australian scale at 03:00 UTC on 9 May, by the Indonesian Agency for Meteorology, Climatology and Geophysics (BMKG),[125] while centred approximately 570 km east of Kupang.[126] Located just inside the area of responsibility of TCWC Jakarta upon reaching tropical cyclone status, the system was officially named Lili by the BMKG.[125]
Soon afterwards, the JTWC followed suit, indicating that the storm's sustained winds had increased to the equivalent of tropical-storm-force on the Saffir–Simpson hurricane wind scale (SSHWS). After turning towards the west-southwest at 00:00 UTC on 10 May, Lili soon began to weaken.[127][128] Despite the marginally favourable environment for strengthening, land interaction and significant dry-air intrusion caused the system to deteriorate.[129] Lili was downgraded to a tropical low at 12:00 UTC on 10 May,[130] and dissipated by 06:00 UTC on 11 May, upon making landfall in northern East Timor.[131][132]
Tropical Cyclone Ann
[edit]| Category 2 tropical cyclone (Australian scale) | |
| Tropical storm (SSHWS) | |
| Duration | 9 May (Entered basin) – 18 May (Out of basin on 10 May) |
|---|---|
| Peak intensity | 95 km/h (60 mph) (10-min); 993 hPa (mbar) |
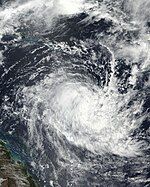
On 7 May, the Bureau of Meteorology indicated that a tropical low had developed within the South Pacific basin. The weak system tracked slowly towards the southwest, passing close to Honiara in the Solomon Islands on 8 May.[133] At 06:00 UTC on 9 May, the tropical low crossed the 160th meridian east and entered the Australian region from the South Pacific basin.[134] The environment was generally favourable for further development, with warm sea surface temperatures and good upper outflow, as well as relatively low vertical wind shear.[135][136] The system turned back eastward on 10 May, exiting the region by 06:00 UTC.[137] The Bureau of Meteorology noted that the environment had become unfavourable for further intensification;[138] however, contradicting this, the Joint Typhoon Warning Center forecast a gradual strengthening to tropical cyclone intensity over the following days in a supportive environment for cyclogenesis.[139] Just twelve hours later, at 18:00 UTC on 10 May, the tropical low tracked back westward, entering the Australian region for the second time.[140]
The storm's low-level circulation proceeded to organise as deep convection developed around the centre, and the BOM upgraded the system to a Category 1 tropical cyclone at 18:00 UTC on 11 May, assigning the name Ann.[141] Ann continued to strengthen, and the system attained Category 2 intensity at 18:00 UTC on the next day. However, the storm encountered unfavourable conditions soon afterward, weakening back to a Category 1 tropical cyclone on 13 May, as the system approached the far-northern coast of Queensland. Weakening continued in the only marginally-supportive environment, with deep convection becoming displaced to the south of an increasingly-exposed low-level circulation centre. Ann was re-classified as a tropical low by the BoM at 03:00 UTC on 14 May, despite still producing gale-force winds, while located approximately 335 km (208 mi) east-northeast of Cooktown. Weakening continued, and the system made landfall near the town of Lockhart River on Cape York Peninsula at approximately 04:30 UTC on 15 May. Ex-Tropical Cyclone Ann emerged over the Gulf of Carpentaria after 06:00 UTC as a shallow circulation, and degenerated into a weak remnant low twelve hours later.[142][143] Ann entered the Arafura Sea on 16 May while continuing to drift westward. The storm was last mentioned by the BoM on 17 May, eventually dissipating near East Timor by 06:30 UTC on 18 May.[144][145]
Other systems
[edit]On the morning of 14 November, the Bureau of Meteorology noted the development of a tropical low in an area of thunderstorms situated about 490 km (305 mi) to northwest of Christmas Island.[22] Located over the warm waters of the tropical Indian Ocean off the coast of Java, the system was forecast to track southeastward over the following days, and was assessed as having a moderate chance of developing into a tropical cyclone.[22] The tropical low tracked in a generally south-southwesterly direction over the following few days, but remained below tropical cyclone intensity, due to atmospheric conditions that were unconducive to cyclogenesis. The system later dissipated on 18 November.
On 9 December, the Bureau of Meteorology announced the development of a weak tropical low from a low-pressure system moving westwards through the mid-eastern Coral Sea, located approximately 1,100 km (680 mi) east-northeast of Townsville.[146]
On 27 December, the Bureau of Meteorology indicated that a weak tropical low had developed over the Timor Sea, approximately 490 km (300 mi) northwest of Darwin.[147] In accordance with official forecasts, the tropical low did not strengthen, and dissipated on 28 December.
On 30 December, a weak tropical low developed over the Indian Ocean, south of the main Indonesian island of Java.[148] Atmospheric conditions were unfavourable for significant development of the system, however, and as such, the tropical low did not intensify. The system meandered south of Indonesia before dissipating on 2 January.[149]
On 15 January, Tropical Low 11U developed over the Indian Ocean, meandering over the ocean until its dissipation two weeks later on 29 January.
On 14 February, the post-tropical remnants of Cyclone Gelena from the South-West Indian Ocean entered the Australian region basin, before dissipating on 15 February.
On 6 March, Tropical Low 15U developed over the Banda Sea, dissipating on 11 March.
Storm names
[edit]Bureau of Meteorology
[edit]Since the start of the 2008–09 season, there has only been one list from which the Bureau of Meteorology has assigned names to tropical cyclones, despite still operating three separate tropical cyclone warning centres (TCWCs) in Perth, Darwin and Brisbane.[150] These warning centres monitor all tropical cyclones that form within the Australian region, including any within the areas of responsibility of TCWC Jakarta or TCWC Port Moresby. The tropical cyclone names that were assigned by the BOM during the 2018–19 season are as follows:
In 2020, the Bureau of Meteorology announced the names Trevor, Veronica and Ann would be retired due to the damage and notorieties associated with the systems. They were replaced with Trung, Verity and Amber respectively.
TCWC Jakarta
[edit]The tropical cyclone warning centre in Jakarta monitors tropical cyclones from the Equator to 11°S and between the longitudes 90°E and 145°E. The names assigned by TCWC Jakarta during the season to tropical cyclones that developed within their area of responsibility are given below:[150]
- Kenanga
- Lili
Tropical cyclones named by TCWC Jakarta are normally rare; however this was the second season in a row in which at least two names were used.
TCWC Port Moresby
[edit]Tropical cyclones that develop between the Equator and 11°S, between 151°E and 160°E, are assigned names by the tropical cyclone warning centre in Port Moresby, Papua New Guinea. No tropical cyclones were named by the PNG National Weather Service during the season. Tropical cyclone formation in this area is rare, with no cyclones being named in it since 2007.[151]
Others
[edit]Tropical Cyclone Oma re-entered the Australian region in the Coral Sea on 21 February as a Category 2 tropical cyclone. Its name was assigned by the Fiji Meteorological Service, as it first intensified to tropical cyclone strength while located in the South Pacific cyclone region.
Season effects
[edit]| Name | Dates | Peak intensity | Areas affected | Damage (US$) |
Deaths | |||
|---|---|---|---|---|---|---|---|---|
| Category | Wind speed (km/h (mph)) |
Pressure (hPa) | ||||||
| Liua | 26–29 Sep | Tropical low | 55 (35) | 995 | Papua New Guinea, Solomon Islands | None | 0 | |
| Bouchra | 9–16 Nov | Tropical low | 55 (35) | 1004 | None | None | 0 | |
| TL | 14–18 Nov | Tropical low | Not specified | 1004 | Java, Christmas Island | None | 0 | |
| Owen | 29 Nov – 17 Dec | Category 3 severe tropical cyclone | 155 (100) | 956 | Solomon Islands, Papua New Guinea, Queensland, Northern Territory | 25 million | 1 | [28] [152] |
| TL | 9–12 Dec | Tropical low | Not specified | 1005 | Solomon Islands, Queensland | None | 0 | |
| Kenanga | 14–16 Dec | Category 1 tropical cyclone | 75 (45) | 995 | None | None | 0 | |
| Penny | 26 Dec – 9 Jan | Category 2 tropical cyclone | 95 (60) | 987 | Papua New Guinea, Queensland | Minor | 0 | |
| TL | 27–28 Dec | Tropical low | Not specified | 1001 | Timor, Northern Territory | None | 0 | |
| Mona | 28–31 Dec | Tropical low | Not specified | 1002 | Solomon Islands | None | 0 | |
| TL | 30 Dec – 2 Jan | Tropical low | Not specified | 1005 | None | None | 0 | |
| 11U | 15–29 Jan | Tropical low | Not specified | 1004 | None | None | 0 | |
| Riley | 19–30 Jan | Category 3 severe tropical cyclone | 120 (75) | 974 | Western Australia | None | 0 | |
| 13U | 21–25 Jan | Tropical low | 55 (35) | 999 | Queensland | None | 0 | |
| Oma | 7–22 Feb | Category 2 tropical cyclone | 100 (65) | 979 | Solomon Islands, Queensland, New South Wales |
500,000 | 1 | |
| 15U | 6–11 Mar | Tropical low | Not specified | 1007 | Maluku Islands, East Timor | None | 0 | |
| Savannah | 8–17 Mar | Category 4 severe tropical cyclone | 175 (110) | 953 | Java, Christmas Island, Cocos Islands | >7.5 million | 12 | [45] [46] |
| 18U | 13–14 Mar | Tropical low | Not specified | 1006 | None | None | 0 | |
| Trevor | 15–26 Mar | Category 4 severe tropical cyclone | 185 (115) | 944 | Papua New Guinea, Queensland, Northern Territory | 700,000 | 0 | |
| Veronica | 18–31 Mar | Category 5 severe tropical cyclone | 215 (130) | 928 | Timor, Western Australia | 1.2 billion | 0 | [64] |
| Wallace | 3–12 Apr | Category 2 tropical cyclone | 100 (65) | 986 | None | None | 0 | |
| 22U | 5–15 Apr | Tropical low | 65 (40) | 1005 | New Guinea, Queensland, Northern Territory, Western Australia | None | 0 | |
| 23U | 21–26 Apr | Tropical low | 55 (35) | 998 | Sumatra, Cocos Islands | None | 0 | |
| Lili | 4–11 May | Category 1 tropical cyclone | 75 (45) | 997 | Eastern Indonesia, East Timor, Top End, Northern Kimberley |
Moderate | 0 | |
| Ann | 9–18 May | Category 2 tropical cyclone | 95 (60) | 993 | Solomon Islands, New Caledonia, Papua New Guinea, Queensland, Top End, Eastern Indonesia, East Timor |
None | 0 | |
| Season aggregates | ||||||||
| 25 systems | 26 Sep – 18 May | 215 (130) | 928 | 1.23 billion | 14 | |||
See also
[edit]- Weather of 2018 and 2019
- Australian region tropical cyclone
- List of off-season Australian region tropical cyclones
- Tropical cyclones in 2018 and 2019
- List of Southern Hemisphere cyclone seasons
- Atlantic hurricane seasons: 2018, 2019
- Pacific hurricane seasons: 2018, 2019
- Pacific typhoon seasons: 2018, 2019
- North Indian Ocean cyclone seasons: 2018, 2019
- 2018–19 South-West Indian Ocean cyclone season
- 2018–19 South Pacific cyclone season
References
[edit]- ^ a b c d e f g h National Climate Centre (8 October 2018). "Australian Tropical Cyclone Outlook for 2018 to 2019: Lower number of cyclones likely for Australia". Australian Bureau of Meteorology. Retrieved 8 October 2018.
- ^ Perth Tropical Cyclone Warning Centre (10 October 2016). "Western Australia Seasonal Tropical Cyclone Outlook 2016–17". Australian Bureau of Meteorology. Archived from the original on 13 December 2016. Retrieved 10 October 2016.
- ^ "Significant Tropical Weather Advisory for the Western and Southern Pacific Oceans September 24, 2018 02:30z". United States Joint Typhoon Warning Center. September 24, 2018. Archived from the original on May 21, 2024. Retrieved December 16, 2018.
- ^ "Gale Warning". Fiji Meteorological Service. 26 September 2018. Archived from the original on 21 May 2024.
- ^ "Tropical Disturbance Advisory 1A (Liua)". Fiji Meteorological Service. 26 September 2018. Archived from the original on 20 May 2024.
- ^ "Liua becomes earliest tropical cyclone on record to form in the South Pacific Ocean – AccuWeather.com". m.accuweather.com. Archived from the original on 2018-09-28. Retrieved 2018-11-10.
- ^ "Tropical Disturbance Advisory 10A (Liua)". Fiji Meteorological Service. 28 September 2018. Archived from the original on 27 September 2018.
- ^ a b "Weekly Tropical Climate Note (2 October 2018)". Bureau of Meteorology. 2 October 2018.
- ^ "MSLP Analysis Chart (06 UTC)". Bureau of Meteorology. 29 September 2018. Retrieved 12 November 2018.
- ^ "Western Region Tropical Cyclone Outlook". Bureau of Meteorology. 23 September 2016. Archived from the original on 21 May 2024.
- ^ "Southern Indonesian Area Tropical Cyclone Outlook". Indonesian Agency for Meteorology, Climatology and Geophysics. 11 October 2016. Archived from the original on 21 May 2024.
- ^ "Western Region Tropical Cyclone Outlook". Bureau of Meteorology. 8 August 2017. Archived from the original on 9 August 2018. Retrieved 8 August 2018.
- ^ "12 UTC Gradient Level Wind Analysis Chart". Bureau of Meteorology. 1 November 2018.
- ^ "Tropical Activity Bulletin" (PDF). Météo-France La Réunion. 9 November 2018.
- ^ "Moderate Tropical Storm Bouchra Forecast Track Map". Météo-France La Réunion. 10 November 2018. Archived from the original on 11 November 2018.
- ^ "Current Tropical Cyclone Basin Activity". Meteorology, Climatology and Geophysical Agency. 10 November 2018. Archived from the original on 23 October 2018.
- ^ "Tropical Cyclone 04S Warning #1". Joint Typhoon Warning Center. 10 November 2018. Archived from the original on 10 November 2018.
- ^ "Tropical Activity Bulletin" (PDF). Météo-France La Réunion. 10 November 2018.
- ^ "Bouchra Analysis Bulletin #2" (PDF). Météo-France La Réunion. 11 November 2018.
- ^ a b "Tropical Activity Bulletin" (PDF). Météo-France La Réunion. 13 November 2018. Retrieved 13 November 2018.
- ^ "Western Region Tropical Cyclone Outlook". Bureau of Meteorology. 13 November 2018. Archived from the original on 13 November 2018. Retrieved 13 November 2018.
- ^ a b c "Western Region Tropical Cyclone Outlook". Bureau of Meteorology. 14 November 2018. Archived from the original on 14 November 2018. Retrieved 14 November 2018.
- ^ "Eastern Region Tropical Cyclone Outlook". Bureau of Meteorology. 29 November 2018. Archived from the original on 29 November 2018. Retrieved 29 November 2018.
- ^ "Tropical Cyclone Formation Alert (Owen)". Joint Typhoon Warning Center. 30 November 2018. Archived from the original on 1 December 2018. Retrieved 1 December 2018.
- ^ "Tropical Cyclone 05P (Owen) Warning #1". Joint Typhoon Warning Center. 2 December 2018. Archived from the original on 2 December 2018. Retrieved 2 December 2018.
- ^ "Tropical Cyclone Owen Forecast Track Map #3". Bureau of Meteorology. 2 December 2018. Archived from the original on 2 December 2018. Retrieved 2 December 2018.
- ^ "Tropical Cyclone Owen Advice 39". Bureau of Meteorology. 15 December 2018. Archived from the original on 21 May 2024. Retrieved 15 December 2018.
- ^ a b "Man swept to his death after ex-cyclone Owen's record rain, as crocs let loose". The New Daily. 16 December 2018. Retrieved 17 December 2018.
- ^ "Ex-Cyclone Owen downgraded to tropical low half a day after crossing Queensland coast". Australian Broadcasting Corporation. 15 December 2018. Retrieved 15 December 2018.
- ^ a b c "Eastern Region Tropical Cyclone Outlook". Bureau of Meteorology. 28 December 2018. Archived from the original on 28 December 2018. Retrieved 28 December 2018.
- ^ "12 UTC Australian Region MSLP Analysis" (PDF). Bureau of Meteorology. 28 December 2018. Archived (PDF) from the original on 13 September 2018. Retrieved 28 December 2018.
- ^ "Weekly Tropical Climate Note". Bureau of Meteorology. 18 December 2018. Archived from the original on 28 December 2018. Retrieved 28 December 2018.
- ^ "Tropical Cyclone Advice #1 (Penny)". Bureau of Meteorology. 30 December 2018. Archived from the original on 25 August 2018. Retrieved 30 December 2018.
- ^ a b "12 UTC Tropical Cyclone Forecast Track Map (Penny)". Bureau of Meteorology. 1 January 2019. Archived from the original on 1 January 2019. Retrieved 1 January 2019.
- ^ a b "09 UTC Tropical Cyclone Technical Bulletin (Penny)". Bureau of Meteorology. 1 January 2019. Archived from the original on 27 January 2019. Retrieved 1 January 2019.
- ^ "Thursday Island Observations". Bureau of Meteorology. 1 January 2019. Archived from the original on 2 January 2019. Retrieved 2 January 2019.
- ^ "18 UTC Tropical Cyclone Forecast Track Map (Penny)". Bureau of Meteorology. 1 January 2018. Archived from the original on 2 January 2019. Retrieved 2 January 2018.
- ^ "Eastern Region Tropical Cyclone Outlook". Bureau of Meteorology. 31 December 2018. Archived from the original on 1 January 2019. Retrieved 1 January 2019.
- ^ "Severe Tropical Cyclone Riley, Western Australian Regional Office". Bureau of Meteorology. February 1, 2019. Archived from the original on 2020-02-11.
- ^ "Tropical Cyclone 13U – Townsville and NW Queensland floods". bom.gov.au. Bureau of Meteorology. January 26, 2019. Retrieved January 19, 2021.
- ^ a b "Eastern Region Tropical Cyclone Outlook". Bureau of Meteorology. 7 February 2019. Archived from the original on 25 January 2019. Retrieved 7 February 2019.
- ^ a b Tom Forbes (25 February 2019). "Swimmer drowns in Cyclone Oma aftermath as swathe of Queensland beaches battle erosion". ABC News. Retrieved 27 February 2019.
- ^ "Dozens rescued from south-east Queensland beaches as ex-Tropical Cyclone Oma departs". ABC News. 24 February 2019. Retrieved 27 February 2019.
- ^ Olivia Ralph and Kim Honan (25 February 2019). "Cudgen banana grower's crop smashed by ex-Tropical Cyclone Oma". ABC News. Retrieved 27 February 2019.
- ^ a b Bagus, Rahadian (7 March 2019). "Kecelakaan Mobil di Jalan Tol Madiun-Surabaya, Bocah 5 Tahun Tewas" (in Indonesian). Tribunnews. Retrieved 17 March 2019.
- ^ a b Muryanto, Bambang (18 March 2019). "Five dead, one missing after flooding, landslides in Yogyakarta". The Jakarta Post. Retrieved 18 March 2019.
- ^ Muhlis, Al Alawi (10 March 2019). "Kapolres: Kabar 2 Orang Tewas akibat Banjir di Madiun Hoaks" (in Indonesian). Regional Kompas. Retrieved 18 March 2019.
- ^ Mustofa, Ali (6 March 2019). "Kerugian Akibat Banjir Madiun Capai Rp54 Miliar!" (in Indonesian). Madiunpos. Archived from the original on 27 March 2019. Retrieved 18 March 2019.
- ^ "Empat Wisatawan Tewas Terseret Banjir Bandang" (in Indonesian). Tribun Bali. 13 March 2019. Retrieved 18 March 2019.
- ^ "38 Desa di Bojonegoro Tergenang Banjir, Kerugian Capai Rp 4 Miliar" (in Indonesian). Kumparan. 8 March 2019. Retrieved 18 March 2019.
- ^ "Banjir di Ngawi, Petani Merugi hingga Rp 33 Miliar" (in Indonesian). Jawa Pos News Network. 11 March 2019. Retrieved 18 March 2019.
- ^ Pebrianti, Charoline (15 March 2019). "Banjir 2 Hari Rugikan Ponorogo Rp 9 Miliar" (in Indonesian). detikNews. Retrieved 18 March 2019.
- ^ "Banjir timbulkan kerugian Rp5 miliar lebih di Tulungagung" (in Indonesian). Antara Aceh. 11 March 2019. Retrieved 18 March 2019.
- ^ Iswinarno, Chandra (11 March 2019). "BPBD Magetan: Kerugian Akibat Banjir Hampir Rp 1 Miliar" (in Indonesian). Suara. Retrieved 18 March 2019.
- ^ Prakoso, Taufik (13 March 2019). "32,75 Ha Sawah Puso Karena Banjir, Petani Klaten Rugi Ratusan Juta Rupiah" (in Indonesian). Soloraya. Retrieved 18 March 2019.
- ^ Perdana (8 March 2019). "Banjir Sukoharjo, Kerugian Capai Rp 300 Juta, Sawah Terendam 379 Ha" (in Indonesian). Radar Solo. Archived from the original on 24 May 2019. Retrieved 18 March 2019.
- ^ Mustofa, Ali (11 March 2019). "Disapu Air Bah, Rumah Subsidi Seharga Rp 150 Juta Diterjang Banjir" (in Indonesian). Radar Solo. Retrieved 18 March 2019.
- ^ "Severe Tropical Cyclone Trevor, Northern Territory Regional Office". Bureau of Meteorology. March 25, 2019. Retrieved January 21, 2021.
- ^ Barker, Eric (March 25, 2019). "Cyclone Trevor flooding prompts fears for thousands of Far North Queensland cattle". ABC News. Retrieved March 26, 2019.
- ^ "Tropical Cyclone Veronica Forecast Track Map (12 UTC)". Bureau of Meteorology. 20 March 2019. Archived from the original on 20 March 2019. Retrieved 20 March 2019.
- ^ "Western Australia's iron ore export ports remain shut as cyclone set to pass Monday". Hellenic Shipping News. 22 March 2019. Retrieved 27 March 2019.
- ^ "UPDATE: Pilbara coast ports re-open as Veronica gone". Mysteel Global. 26 March 2019. Retrieved 27 March 2019.
- ^ Smyth, Jamie (1 April 2019). "Cyclone damage dents Rio Tinto's 2019 iron ore outlook". Financial Times. Archived from the original on 1 April 2019. Retrieved 1 April 2019.
- ^ a b c d Dyer, Glenn (2 April 2019). "Rio Confirms Cyclone Veronica Damage". ShareCafe. Retrieved 2 April 2019.
- ^ "Weekly Tropical Climate Note". Bureau of Meteorology. 26 March 2019. Archived from the original on 1 April 2019. Retrieved 1 April 2019.
- ^ "Australian Region MSLP Chart (12 UTC)". Bureau of Meteorology. 31 March 2019. Archived from the original on 4 April 2019. Retrieved 4 April 2019.
- ^ "Weekly Tropical Climate Note". Bureau of Meteorology. 2 April 2019. Archived from the original on 4 April 2019. Retrieved 3 April 2019.
- ^ "Eastern Region Tropical Cyclone Outlook". Bureau of Meteorology. 31 March 2019. Archived from the original on 31 March 2019. Retrieved 31 March 2019.
- ^ "Northern Region Tropical Cyclone Outlook". Bureau of Meteorology. 1 April 2019. Archived from the original on 1 April 2019. Retrieved 1 April 2019.
- ^ "Western Region Tropical Cyclone Outlook". Bureau of Meteorology. 3 April 2019. Archived from the original on 4 April 2019. Retrieved 3 April 2019.
- ^ "Tropical Cyclone Technical Bulletin #1 (Wallace)". Bureau of Meteorology. 4 April 2019. Archived from the original on 4 April 2019. Retrieved 4 April 2019.
- ^ "Tropical Cyclone Formation Alert (Wallace)". Joint Typhoon Warning Center. 4 April 2019. Archived from the original on 4 April 2019. Retrieved 4 April 2019.
- ^ "Tropical Cyclone Warning #1 (Wallace)". Joint Typhoon Warning Center. 5 April 2019. Archived from the original on 5 April 2019. Retrieved 5 April 2019.
- ^ "Tropical Cyclone Technical Bulletin #8 (Wallace)". Bureau of Meteorology. 5 April 2019. Archived from the original on 5 April 2019. Retrieved 5 April 2019.
- ^ a b "Tropical Cyclone Technical Bulletin #11 (Wallace)". Bureau of Meteorology. 6 April 2019. Archived from the original on 6 April 2019. Retrieved 6 April 2019.
- ^ "Tropical Cyclone Technical Bulletin #16 (Wallace)". Bureau of Meteorology. 7 April 2019. Archived from the original on 7 April 2019. Retrieved 7 April 2019.
- ^ "12 UTC Tropical Cyclone Information Bulletin (Wallace)". Indonesian Meteorology, Climatology and Geophysical Agency (BMKG) (in Indonesian). 5 April 2019. Archived from the original on 5 April 2019. Retrieved 5 April 2019.
- ^ "00 UTC Tropical Cyclone Information Bulletin". Indonesian Meteorology, Climatology and Geophysical Agency (BMKG) (in Indonesian). 6 April 2019. Archived from the original on 6 April 2019. Retrieved 6 April 2019.
- ^ "Tropical Cyclone Forecast Track Map #8 (Wallace)". Bureau of Meteorology. 5 April 2019. Archived from the original on 5 April 2019. Retrieved 5 April 2019.
- ^ McLennan, Chris (3 April 2019). "Tropical Cyclone Wallace in the Process of Being Born". Katherine Times. Archived from the original on 7 May 2019. Retrieved 7 May 2019.
- ^ "Croker Island Airport Rainfall Observations". Bureau of Meteorology. 5 April 2019. Archived from the original on 5 April 2019. Retrieved 5 April 2019.
- ^ "Browse Island Weather Observations". Bureau of Meteorology. 6 April 2019. Archived from the original on 6 April 2019. Retrieved 6 April 2019.
- ^ "Tropical Cyclone Technical Bulletin #19 (Wallace)". Bureau of Meteorology. 8 April 2019. Archived from the original on 8 April 2019. Retrieved 8 April 2019.
- ^ "Tropical Cyclone Wallace Track File". National Oceanic and Atmospheric Administration. 13 April 2019. Retrieved 16 April 2019.
- ^ "Tropical Cyclone Technical Bulletin #21 (Wallace)". Australian Bureau of Meteorology. 9 April 2019. Archived from the original on 9 April 2019. Retrieved 9 April 2019.
- ^ "Tropical Cyclone Technical Bulletin #23 (Wallace)". Australian Bureau of Meteorology. 9 April 2019. Archived from the original on 9 April 2019. Retrieved 9 April 2019.
- ^ "Tropical Cyclone Forecast Track Map #29 (Wallace)". Australian Bureau of Meteorology. 10 April 2019. Archived from the original on 10 April 2019. Retrieved 10 April 2019.
- ^ "Tropical Cyclone Warning #21 (Wallace)". Joint Typhoon Warning Center. 10 April 2019. Archived from the original on 10 April 2019. Retrieved 10 April 2019.
- ^ "Cyclone Wallace Severe Weather Report". Australian Bureau of Meteorology. Retrieved 6 May 2019.
- ^ "Gradient Level Wind Analysis (12 UTC)". Australian Bureau of Meteorology. 14 April 2019. Archived from the original on 4 August 2017. Retrieved 14 April 2019.
{{cite web}}: CS1 maint: bot: original URL status unknown (link) - ^ "Cocos (Keeling) Islands Rainfall Observations". Bureau of Meteorology. 15 April 2019. Retrieved 7 May 2019.
- ^ "Western Region Tropical Cyclone Outlook". Australian Bureau of Meteorology. 16 April 2019. Archived from the original on 16 April 2019. Retrieved 16 April 2019.
- ^ a b "Northern Region Tropical Cyclone Outlook". Bureau of Meteorology. 5 April 2019. Archived from the original on 6 April 2019. Retrieved 6 April 2019.
- ^ "MSLP Analysis Chart (18 UTC)". Bureau of Meteorology. 6 April 2019.
- ^ "MSLP Analysis Chart (12 UTC)". Bureau of Meteorology. 7 April 2019.
- ^ "MSLP Analysis Chart (18 UTC)". Bureau of Meteorology. 8 April 2019.
- ^ a b "Tropical Weather Advisory for the Indian Ocean". Joint Typhoon Warning Center. 13 April 2019. Archived from the original on 13 April 2019. Retrieved 13 April 2019.
- ^ a b "Varanus Island Weather Observations". Bureau of Meteorology. 14 April 2019. Archived from the original on 14 April 2019. Retrieved 14 April 2019.
- ^ "About Tropical Cyclones". Bureau of Meteorology. Retrieved 14 April 2019.
- ^ "Western Region Tropical Cyclone Outlook". Bureau of Meteorology. 14 April 2019. Archived from the original on 14 April 2019. Retrieved 14 April 2019.
- ^ "Tropical Weather Advisory for the Indian Ocean". Joint Typhoon Warning Center. 14 April 2019. Archived from the original on 14 April 2019. Retrieved 14 April 2019.
- ^ "Western Region Tropical Cyclone Outlook". Bureau of Meteorology. 15 April 2019. Archived from the original on 15 April 2019. Retrieved 15 April 2019.
- ^ "Gove Airport Rainfall Data". Bureau of Meteorology. 10 April 2019. Archived from the original on 10 April 2019. Retrieved 10 April 2019.
- ^ "Gove Airport 2015 Daily Rainfall Observations". Bureau of Meteorology. Retrieved 14 April 2019.
- ^ "Severe Weather Warning for the Arnhem District". Bureau of Meteorology. 6 April 2019. Archived from the original on 7 April 2019. Retrieved 7 April 2019.
- ^ "Browse Island Weather Observations". Bureau of Meteorology. 11 April 2019. Archived from the original on 11 April 2019. Retrieved 11 April 2019.
- ^ "Onslow Airport Weather Observations". Bureau of Meteorology. 14 April 2019. Archived from the original on 14 April 2019. Retrieved 14 April 2019.
- ^ "Barrow Island Weather Observations". Bureau of Meteorology. 14 April 2019. Archived from the original on 14 April 2019. Retrieved 14 April 2019.
- ^ "Roebourne Airport Weather Observations". Bureau of Meteorology. 14 April 2019. Archived from the original on 14 April 2019. Retrieved 14 April 2019.
- ^ "Mardie Weather Observations". Bureau of Meteorology. 14 April 2019. Archived from the original on 14 April 2019. Retrieved 14 April 2019.
- ^ "Karratha Weather Observations". Bureau of Meteorology. 14 April 2019. Archived from the original on 14 April 2019. Retrieved 14 April 2019.
- ^ "Thevenard Island Weather Observations". Bureau of Meteorology. 14 April 2019. Archived from the original on 14 April 2019. Retrieved 14 April 2019.
- ^ "Learmonth Airport Weather Observations". Bureau of Meteorology. 14 April 2019. Archived from the original on 14 April 2019. Retrieved 14 April 2019.
- ^ a b c "Western Region Tropical Cyclone Outlook". Bureau of Meteorology. 21 April 2019. Archived from the original on 22 April 2019. Retrieved 22 April 2019.
- ^ "21 April – 25 April Gradient Level Wind Analyses". Bureau of Meteorology. 25 April 2019. Retrieved 25 April 2019.
- ^ "Invest 92S (Tropical Low 23U?) Track File". Joint Typhoon Warning Center. 25 April 2019. Archived from the original on 25 April 2019. Retrieved 25 April 2019.
- ^ a b c d "Indian Ocean Tropical Weather Advisory". Joint Typhoon Warning Center. 25 April 2019. Archived from the original on 26 April 2019. Retrieved 26 April 2019.
- ^ a b "Western Region Tropical Cyclone Outlook". Bureau of Meteorology. 25 April 2019. Archived from the original on 25 April 2019. Retrieved 25 April 2019.
- ^ "Western Region Tropical Cyclone Outlook". Bureau of Meteorology. 26 April 2019. Archived from the original on 26 April 2019. Retrieved 26 April 2019.
- ^ "West Island Rainfall Data". Bureau of Meteorology. 26 April 2019. Retrieved 26 April 2019.
- ^ a b c "Weekly Tropical Climate Note". Bureau of Meteorology. 30 April 2019. Retrieved 4 May 2019.
- ^ "Western Region Tropical Cyclone Outlook". Bureau of Meteorology. 4 May 2019. Archived from the original on 4 May 2019. Retrieved 4 May 2019.
- ^ "Southeast Asia MSLP Analysis". Bureau of Meteorology. 4 May 2019. Retrieved 4 May 2019.
- ^ a b "Tropical Cyclone Formation Alert (Lili)". Joint Typhoon Warning Center. 7 May 2019. Archived from the original on 7 May 2019. Retrieved 7 May 2019.
- ^ a b "Lili Tropical Cyclone Technical Bulletin (03Z)". Indonesian Agency for Meteorology, Climatology and Geophysics (in Indonesian). 9 May 2019. Archived from the original on 9 May 2019. Retrieved 9 May 2019.
- ^ "Tropical Cyclone Lili Information Bulletin (03Z)". Indonesian Agency for Meteorology, Climatology and Geophysics (in Indonesian). 9 May 2019. Archived from the original on 9 May 2019. Retrieved 9 May 2019.
- ^ "High Seas Warning (00Z)". Indonesian Agency for Meteorology, Climatology and Geophysics (in Indonesian). 10 May 2019. Archived from the original on 10 May 2019. Retrieved 10 May 2019.
- ^ "Tropical Cyclone Lili Technical Bulletin (06Z)". Indonesian Agency for Meteorology, Climatology and Geophysics. 10 May 2019. Archived from the original on 10 May 2019. Retrieved 10 May 2019.
- ^ "Tropical Cyclone Lili Warning #5". Joint Typhoon Warning Center. 10 May 2019. Archived from the original on 10 May 2019. Retrieved 10 May 2019.
- ^ "Tropical Cyclone Forecast Track Map (Lili)". Indonesian Agency for Meteorology, Climatology and Geophysics. 10 May 2019. Archived from the original on 11 May 2019. Retrieved 11 May 2019.
- ^ "Northern Area High Seas Forecast". Bureau of Meteorology. 11 May 2019. Archived from the original on 11 May 2019. Retrieved 11 May 2019.
- ^ "Tropical Cyclone Lili Track File". National Oceanic and Atmospheric Administration. 11 May 2019. Archived from the original on 11 May 2019. Retrieved 11 May 2019.
- ^ "Eastern Region Tropical Cyclone Outlook". Bureau of Meteorology. 8 May 2019. Archived from the original on 8 May 2019. Retrieved 8 May 2019.
- ^ "North Eastern Area High Seas Forecast (06Z)". Bureau of Meteorology. 9 May 2019. Archived from the original on 9 May 2019. Retrieved 9 May 2019.
- ^ "Eastern Region Tropical Cyclone Outlook". Bureau of Meteorology. 9 May 2019. Archived from the original on 9 May 2019. Retrieved 9 May 2019.
- ^ "Tropical Weather Advisory for the Pacific Ocean". Joint Typhoon Warning Center. 9 May 2019. Archived from the original on 9 May 2019. Retrieved 9 May 2019.
- ^ "North Eastern Area High Seas Forecast (06Z)". Bureau of Meteorology. 10 May 2019. Archived from the original on 10 May 2019. Retrieved 10 May 2019.
- ^ "Eastern Region Tropical Cyclone Outlook". Bureau of Meteorology. 10 May 2019. Archived from the original on 10 May 2019. Retrieved 10 May 2019.
- ^ "Tropical Weather Advisory for the Pacific Ocean". Joint Typhoon Warning Center. 10 May 2019. Archived from the original on 10 May 2019. Retrieved 10 May 2019.
- ^ "North Eastern Area High Seas Forecast (18Z)". Bureau of Meteorology. 10 May 2019. Archived from the original on 11 May 2019. Retrieved 11 May 2019.
- ^ "Tropical Cyclone Ann Forecast Track Map #1 (18Z)". Bureau of Meteorology. 11 May 2019. Archived from the original on 11 May 2019. Retrieved 11 May 2019.
- ^ "Northern Area High Seas Forecast (06Z)". Bureau of Meteorology. 15 May 2019. Archived from the original on 15 May 2019. Retrieved 15 May 2019.
- ^ "Northern Area High Seas Forecast (18Z)". Bureau of Meteorology. 15 May 2019. Archived from the original on 16 May 2019. Retrieved 16 May 2019.
- ^ "Arafura Coast Forecast: Cape Don to Cape Wessel (1915Z)". Bureau of Meteorology. 17 May 2019. Archived from the original on 18 May 2019. Retrieved 18 May 2019.
- ^ "Arafura Coast Forecast: Cape Don to Cape Wessel (0630Z)". Bureau of Meteorology. 18 May 2019. Archived from the original on 18 May 2019. Retrieved 18 May 2019.
- ^ "Eastern Region Tropical Cyclone Outlook". Bureau of Meteorology. 9 December 2018. Archived from the original on 9 December 2018. Retrieved 9 December 2018.
- ^ "Western Region Tropical Cyclone Outlook". Bureau of Meteorology. 27 December 2018. Archived from the original on 27 December 2018. Retrieved 27 December 2018.
- ^ "Western Region Tropical Cyclone Outlook". Bureau of Meteorology. 30 December 2018. Archived from the original on 30 December 2018. Retrieved 30 December 2018.
- ^ "Western Region Tropical Cyclone Outlook". Bureau of Meteorology. 3 January 2019. Archived from the original on 3 January 2019. Retrieved 3 January 2019.
- ^ a b "Tropical Cyclone Operational plan for the South Pacific & Southeast Indian Ocean, 2014 Edition" (PDF). WMO. Retrieved 2016-06-12.
- ^ Gary Padgett (2008). "Monthly Global Tropical Cyclone Summary October". Australian Severe Weather. Archived from the original on 2013-07-04. Retrieved 2013-07-01.
- ^ Weather, Climate & Catastrophe Insight: 2018 Annual Report (PDF) (Report). AON Benfield. January 22, 2019. Archived from the original (PDF) on February 14, 2019. Retrieved January 24, 2019.

